Hours before the waitlist application window opened on Monday, April 7th at 9 AM, dozens of people lined up outside THA’s main offices along South L Street. By the time the waitlist closed two weeks later, 15,494 households made up of 36,222 individuals had applied for a chance at one of only 1,825 spots on the low-income housing waitlist.
From April 3-17, the waitlist was open to households of all sizes for the first time since 2015, and the applications offer a look at the scale and scope of the need in our community.
At a Glance
- 15,494 completed applications
- 36,222 people in households
- 37.5 years is the median age of the head of household
- $11,280 is the median household income
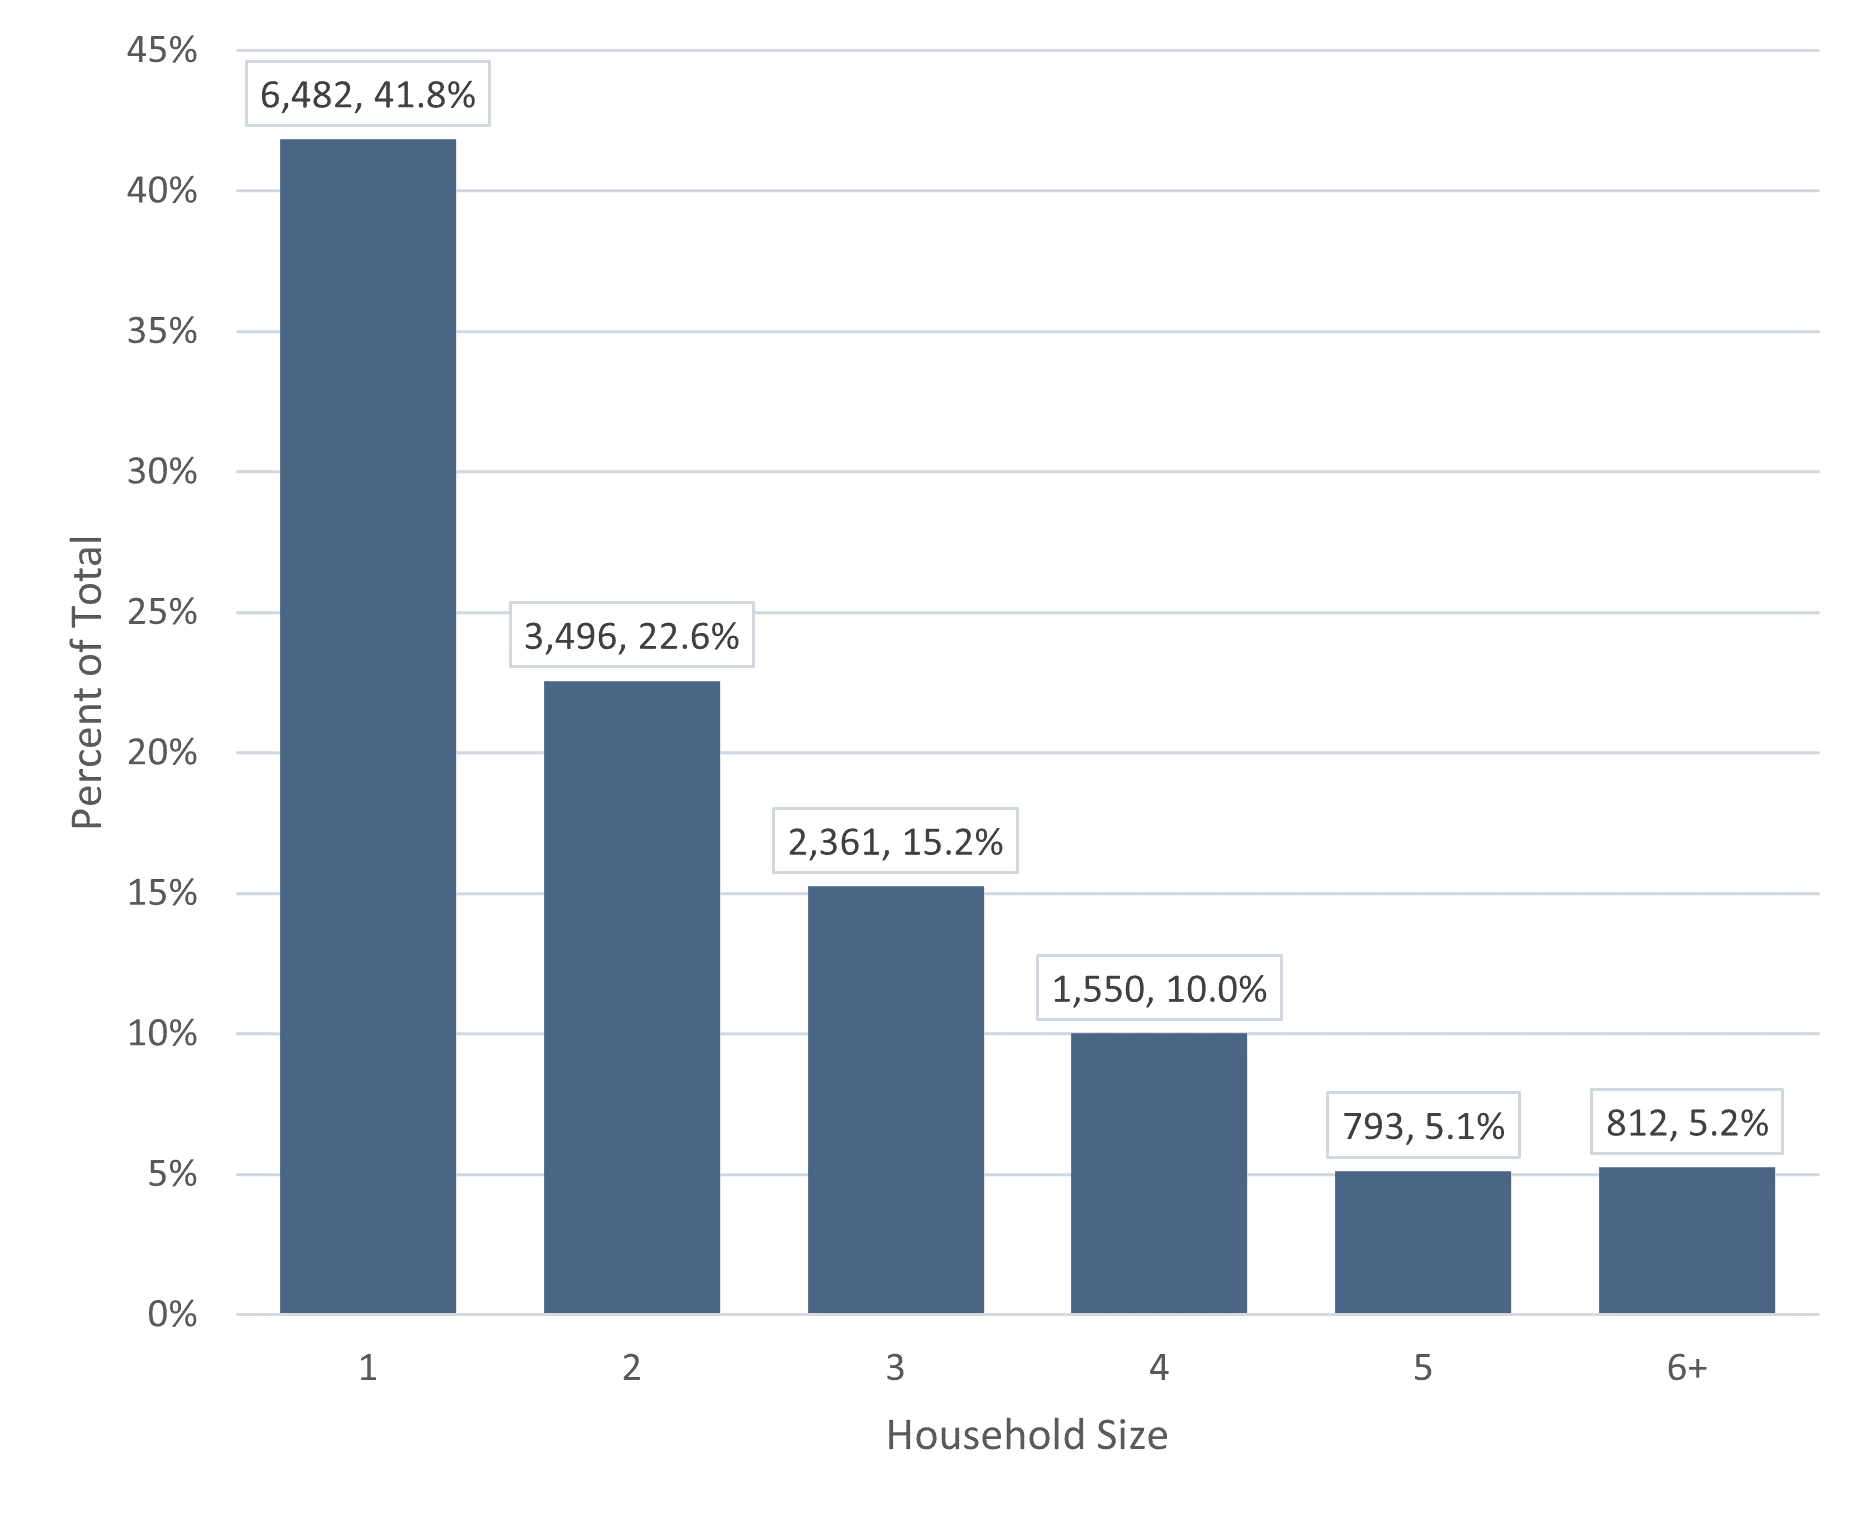
Household Size
| Household Size | Applicants |
|---|---|
| 1 | 6,482 (41.8%) |
| 2 | 3,496 (22.6%) |
| 3 | 2,361 (15.2%) |
| 4 | 1,550 (10.0%) |
| 5 | 793 (5.1%) |
| 6+ | 812 (5.2%) |
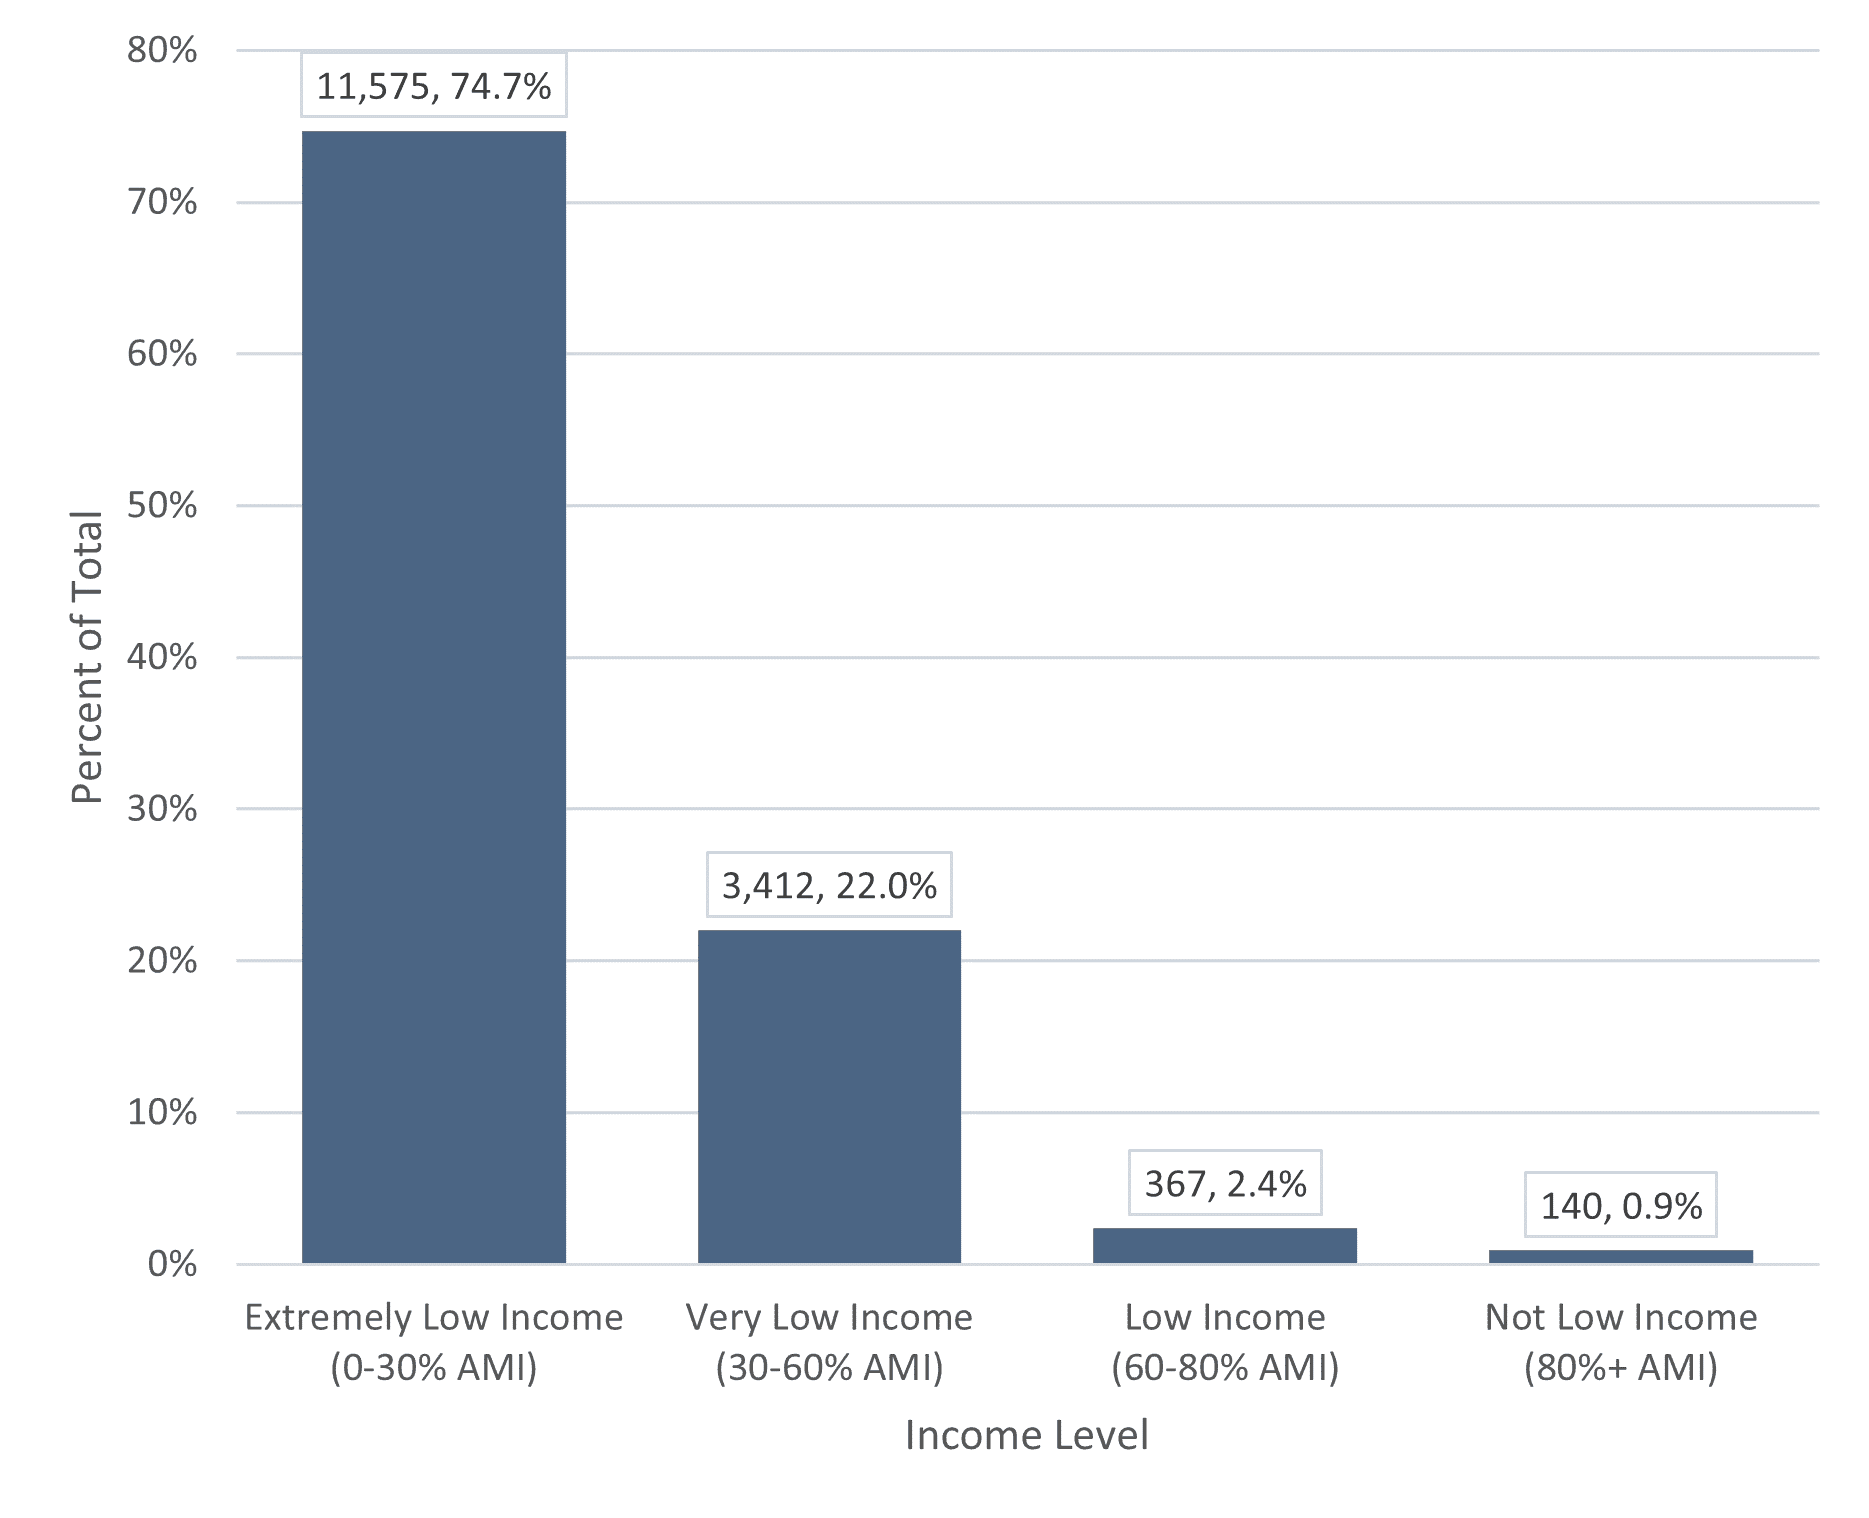
Household Income
| AMI Bucket | Applicants |
|---|---|
| Extremely Low Income (0-30% AMI) | 11,575 (74.7%) |
| Very Low Income (30-60% AMI) | 3,412 (22.0%) |
| Low Income (60-80% AMI) | 367 (2.4%) |
| Not Low Income (80%+ AMI) | 140 (0.9%) |
More about income buckets
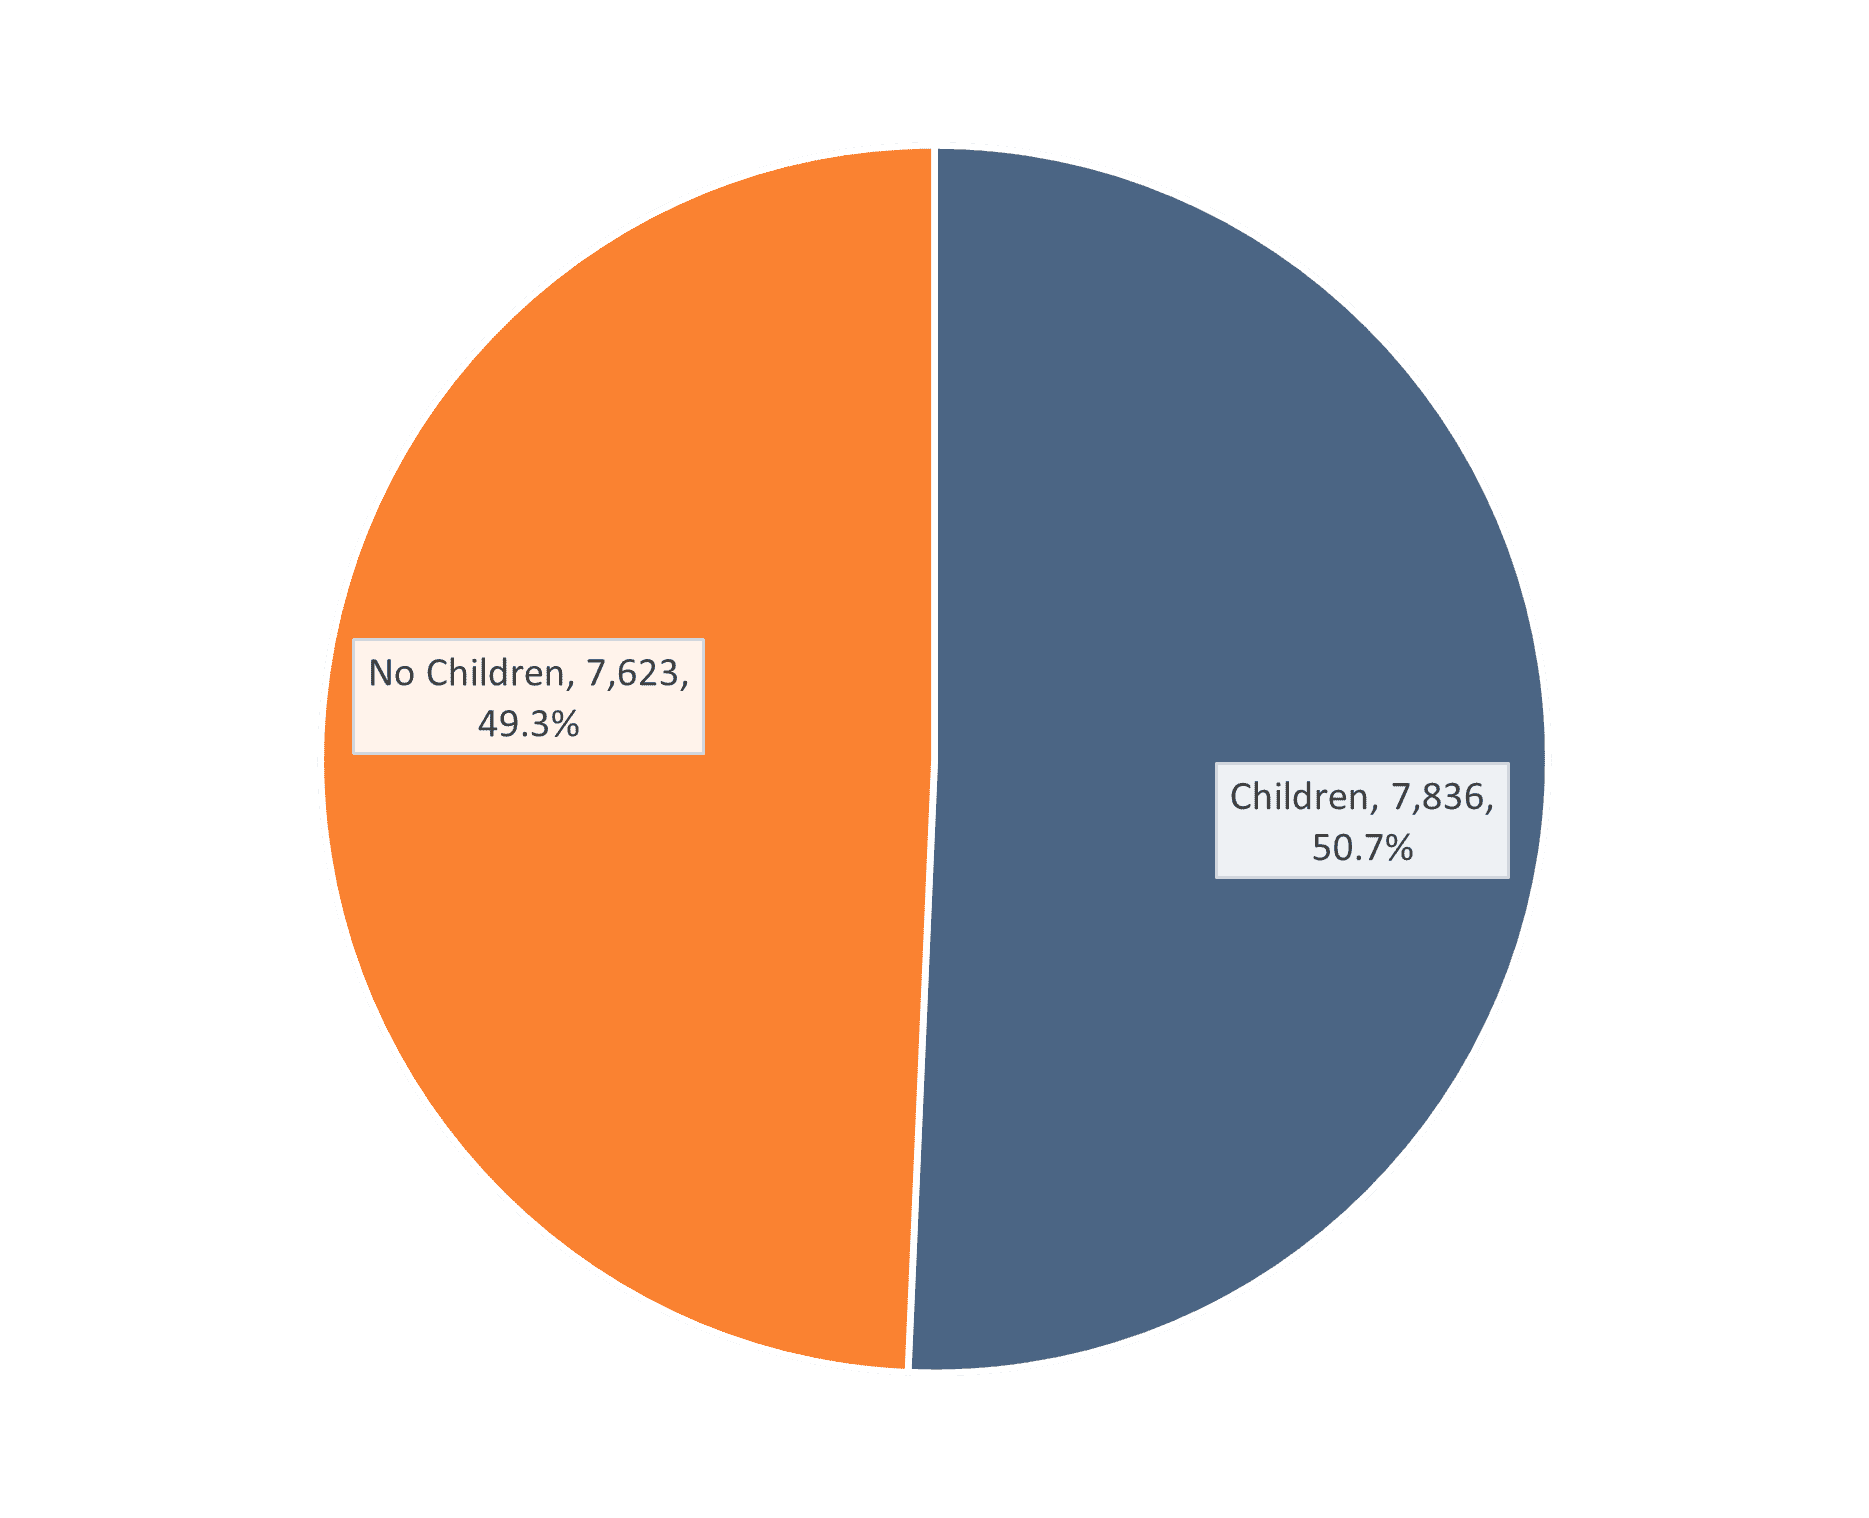
Households with Children
| Children | Applicants |
|---|---|
| Children | 7,836 (50.7%) |
| No Children | 7,623 (49.3%) |
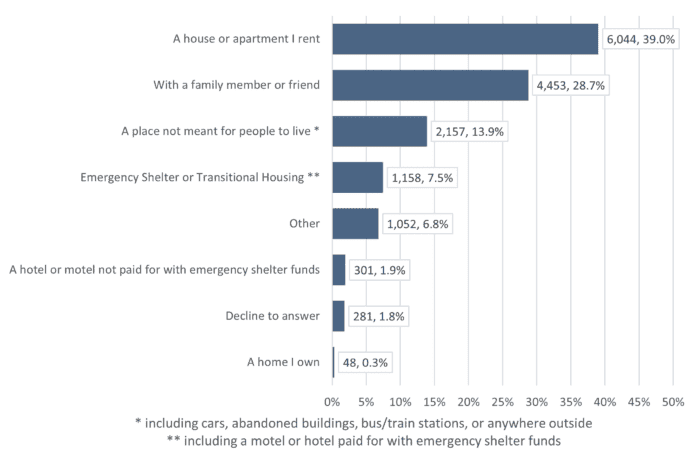
Where Applicants Stayed the Previous Night
| Where Did You Stay Last Night? | Applicants |
|---|---|
| In a house or apartment I rent | 6,044 (39.0%) |
| With a family member or friend | 4,453 (28.7%) |
| In a place not meant for people to live (like a car, abandoned building, bus/train station, or anywhere outside) | 2,157 (13.9%) |
| In an Emergency Shelter or Transitional Housing (including a motel or hotel paid for with emergency shelter funds) | 1,158 (7.5%) |
| Other | 1,052 (6.8%) |
| In a hotel or motel not paid for with emergency shelter funds | 301 (1.9%) |
| Decline to answer | 281 (1.8%) |
| In a home I own | 48 (0.3%) |
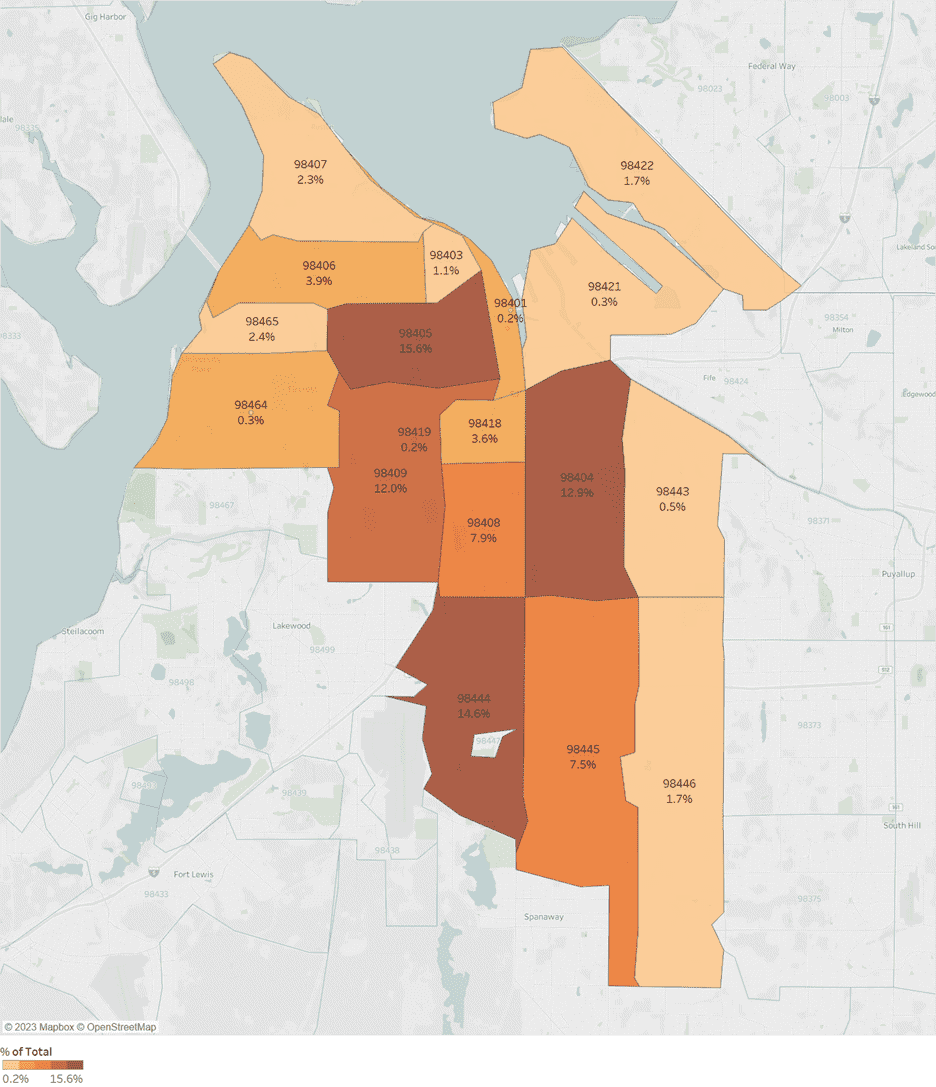
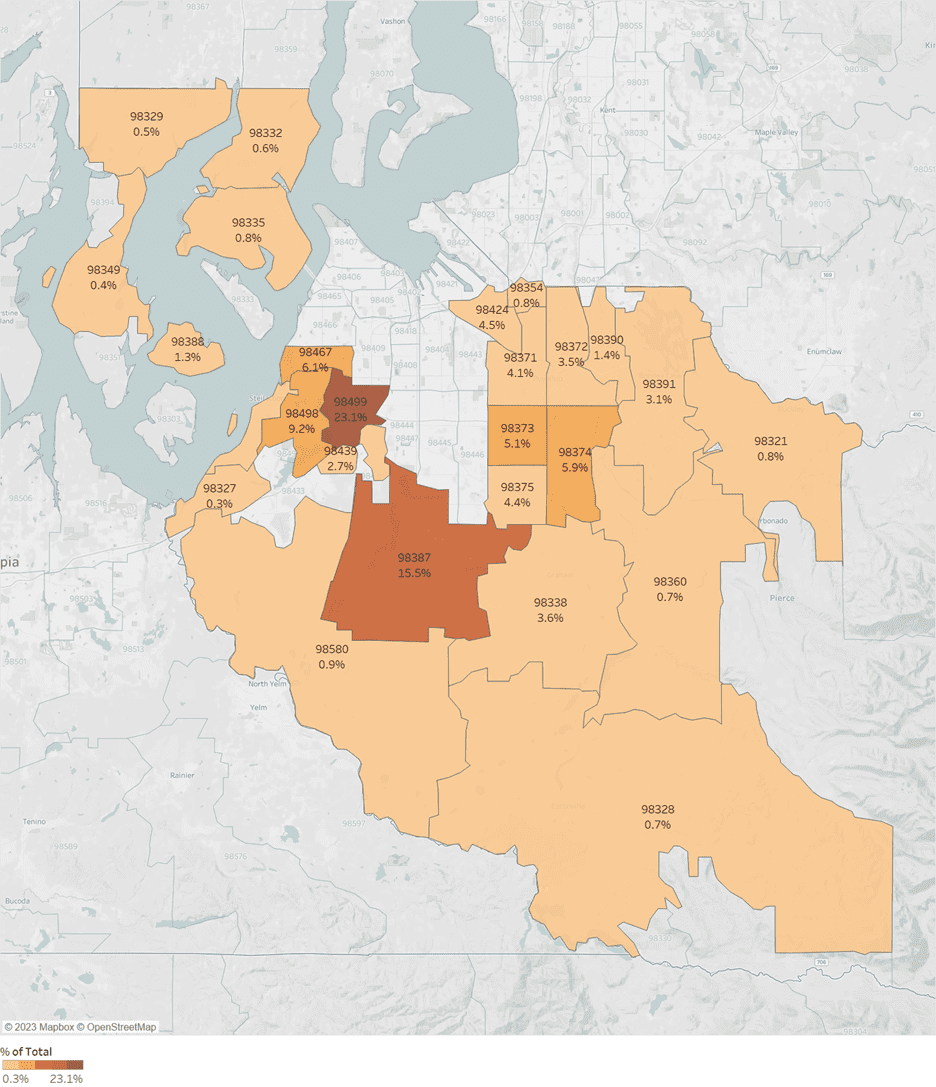
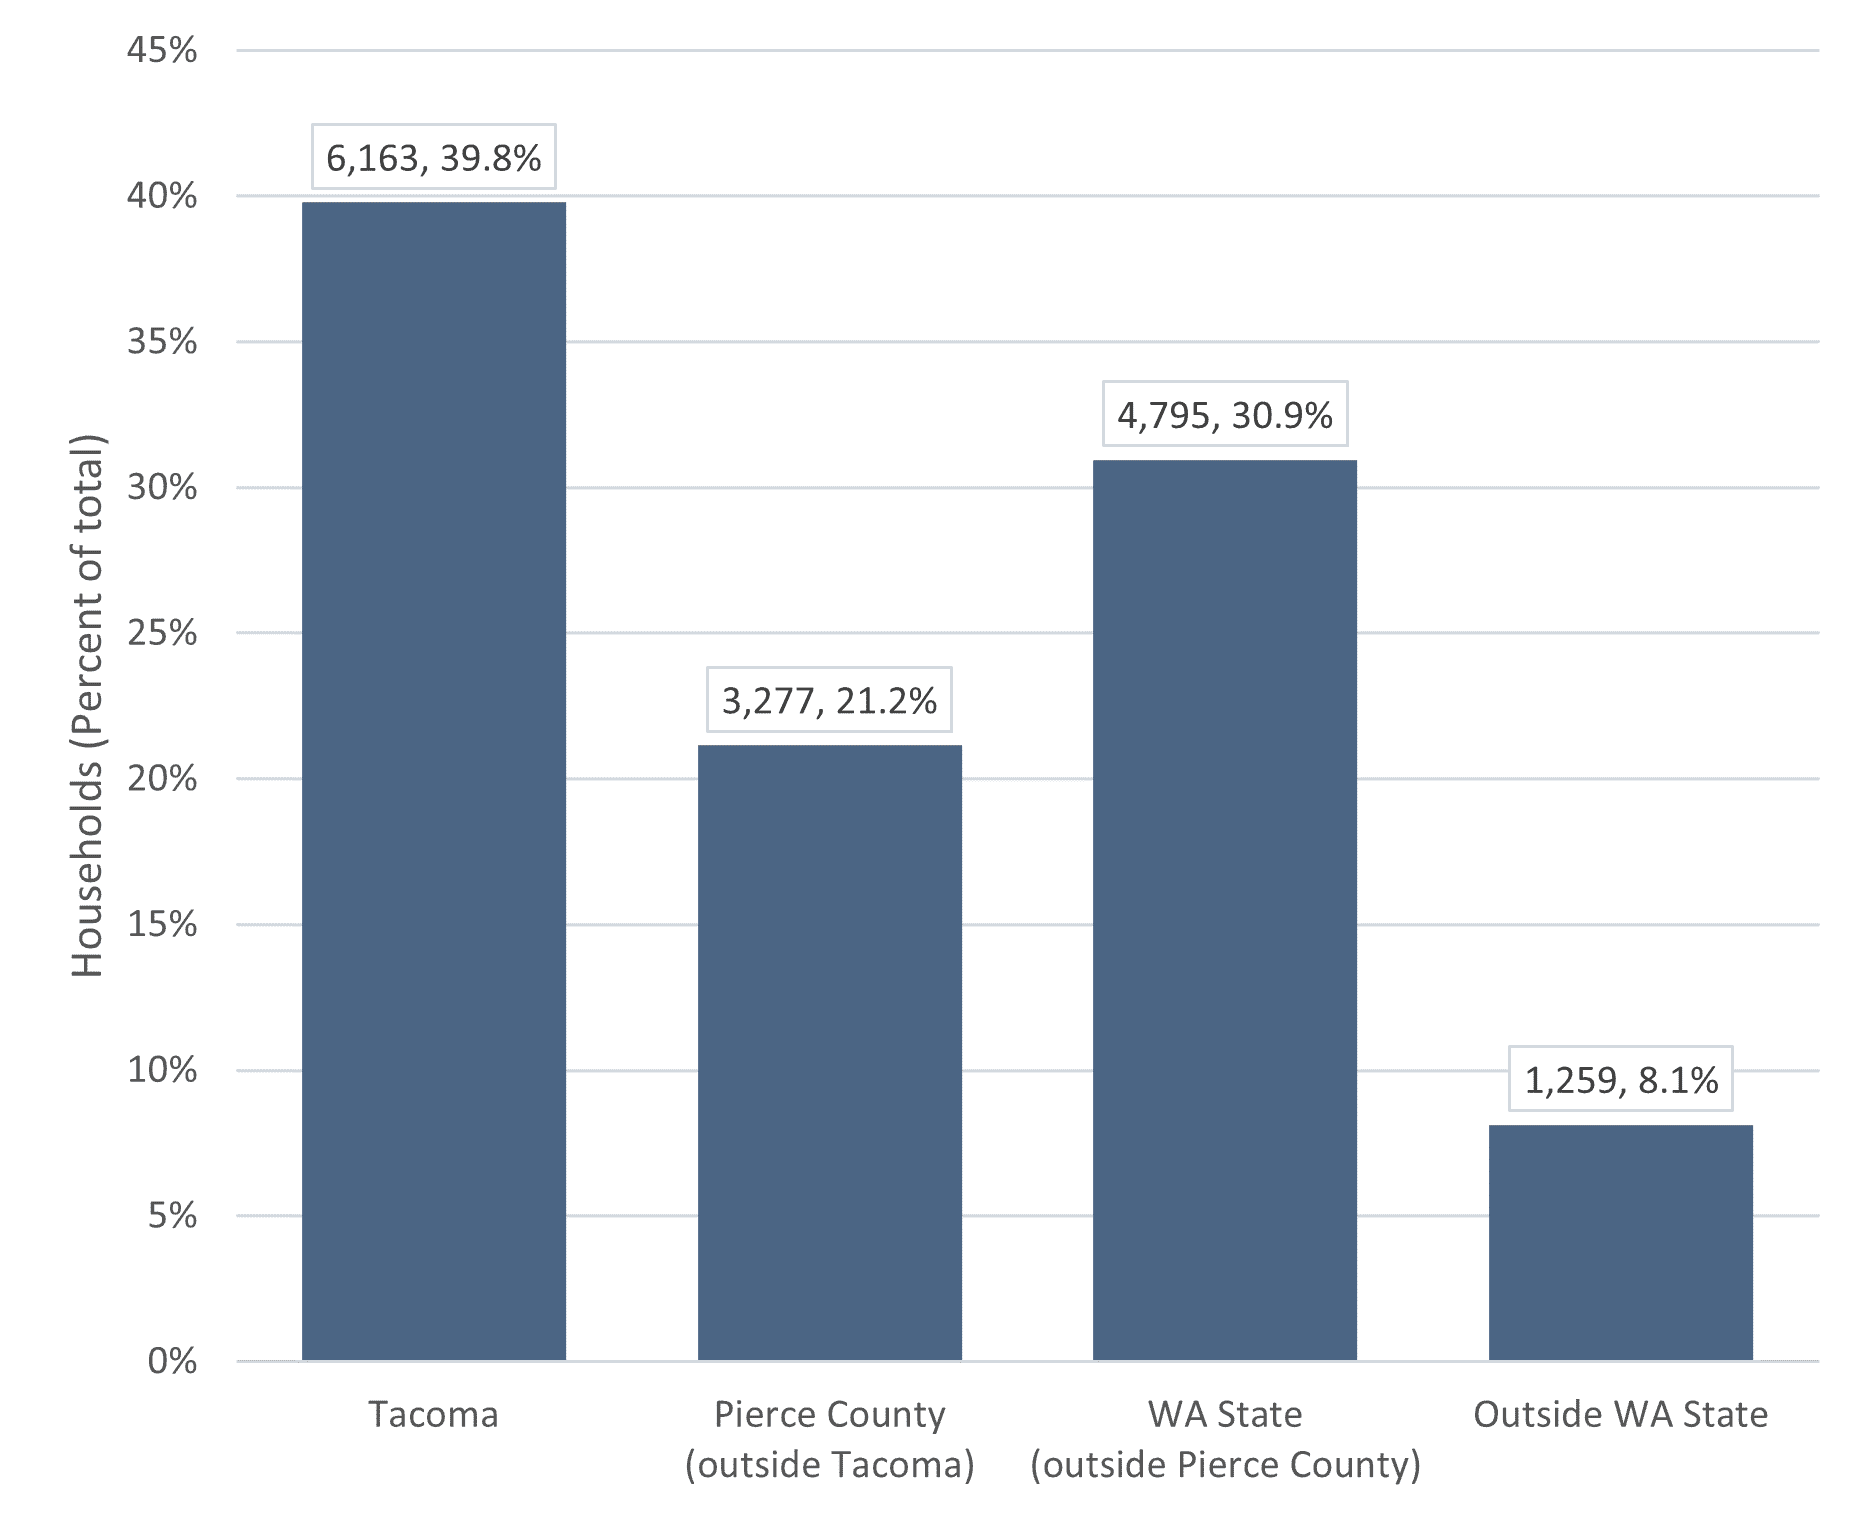
Geography
Not all waitlist applicants currently live within the Greater Tacoma Area. Although most applicants live in Pierce County, nearly 31% (4,795) of applicants reported living in other counties throughout Washington State, and 8% of applicants (1,259) live in different states across the country.
| Location | Applicants |
|---|---|
| Tacoma | 6,163 (39.8%) |
| Pierce County (outside Tacoma) | 3,277 (21.2%) |
| WA State (outside Pierce County) | 4,795 (30.9%) |
| Outsde WA State | 1,259 (8.1%) |
| County | Count | % of US Total Outside WA State |
|---|---|---|
| King | 3,737 | 79.4% |
| Thurston | 322 | 6.8% |
| Snohomish | 191 | 4.1% |
| Kitsap | 142 | 3.0% |
| Unknown WA County | 123 | 2.6% |
| Clark | 37 | 0.8% |
| Lewis | 33 | 0.7% |
| Spokane | 31 | 0.7% |
| Mason | 28 | 0.6% |
| Grays Harbor | 26 | 0.6% |
| Yakima | 18 | 0.4% |
| Island | 10 | 0.2% |
| Cowlitz | 10 | 0.2% |
Head of Household
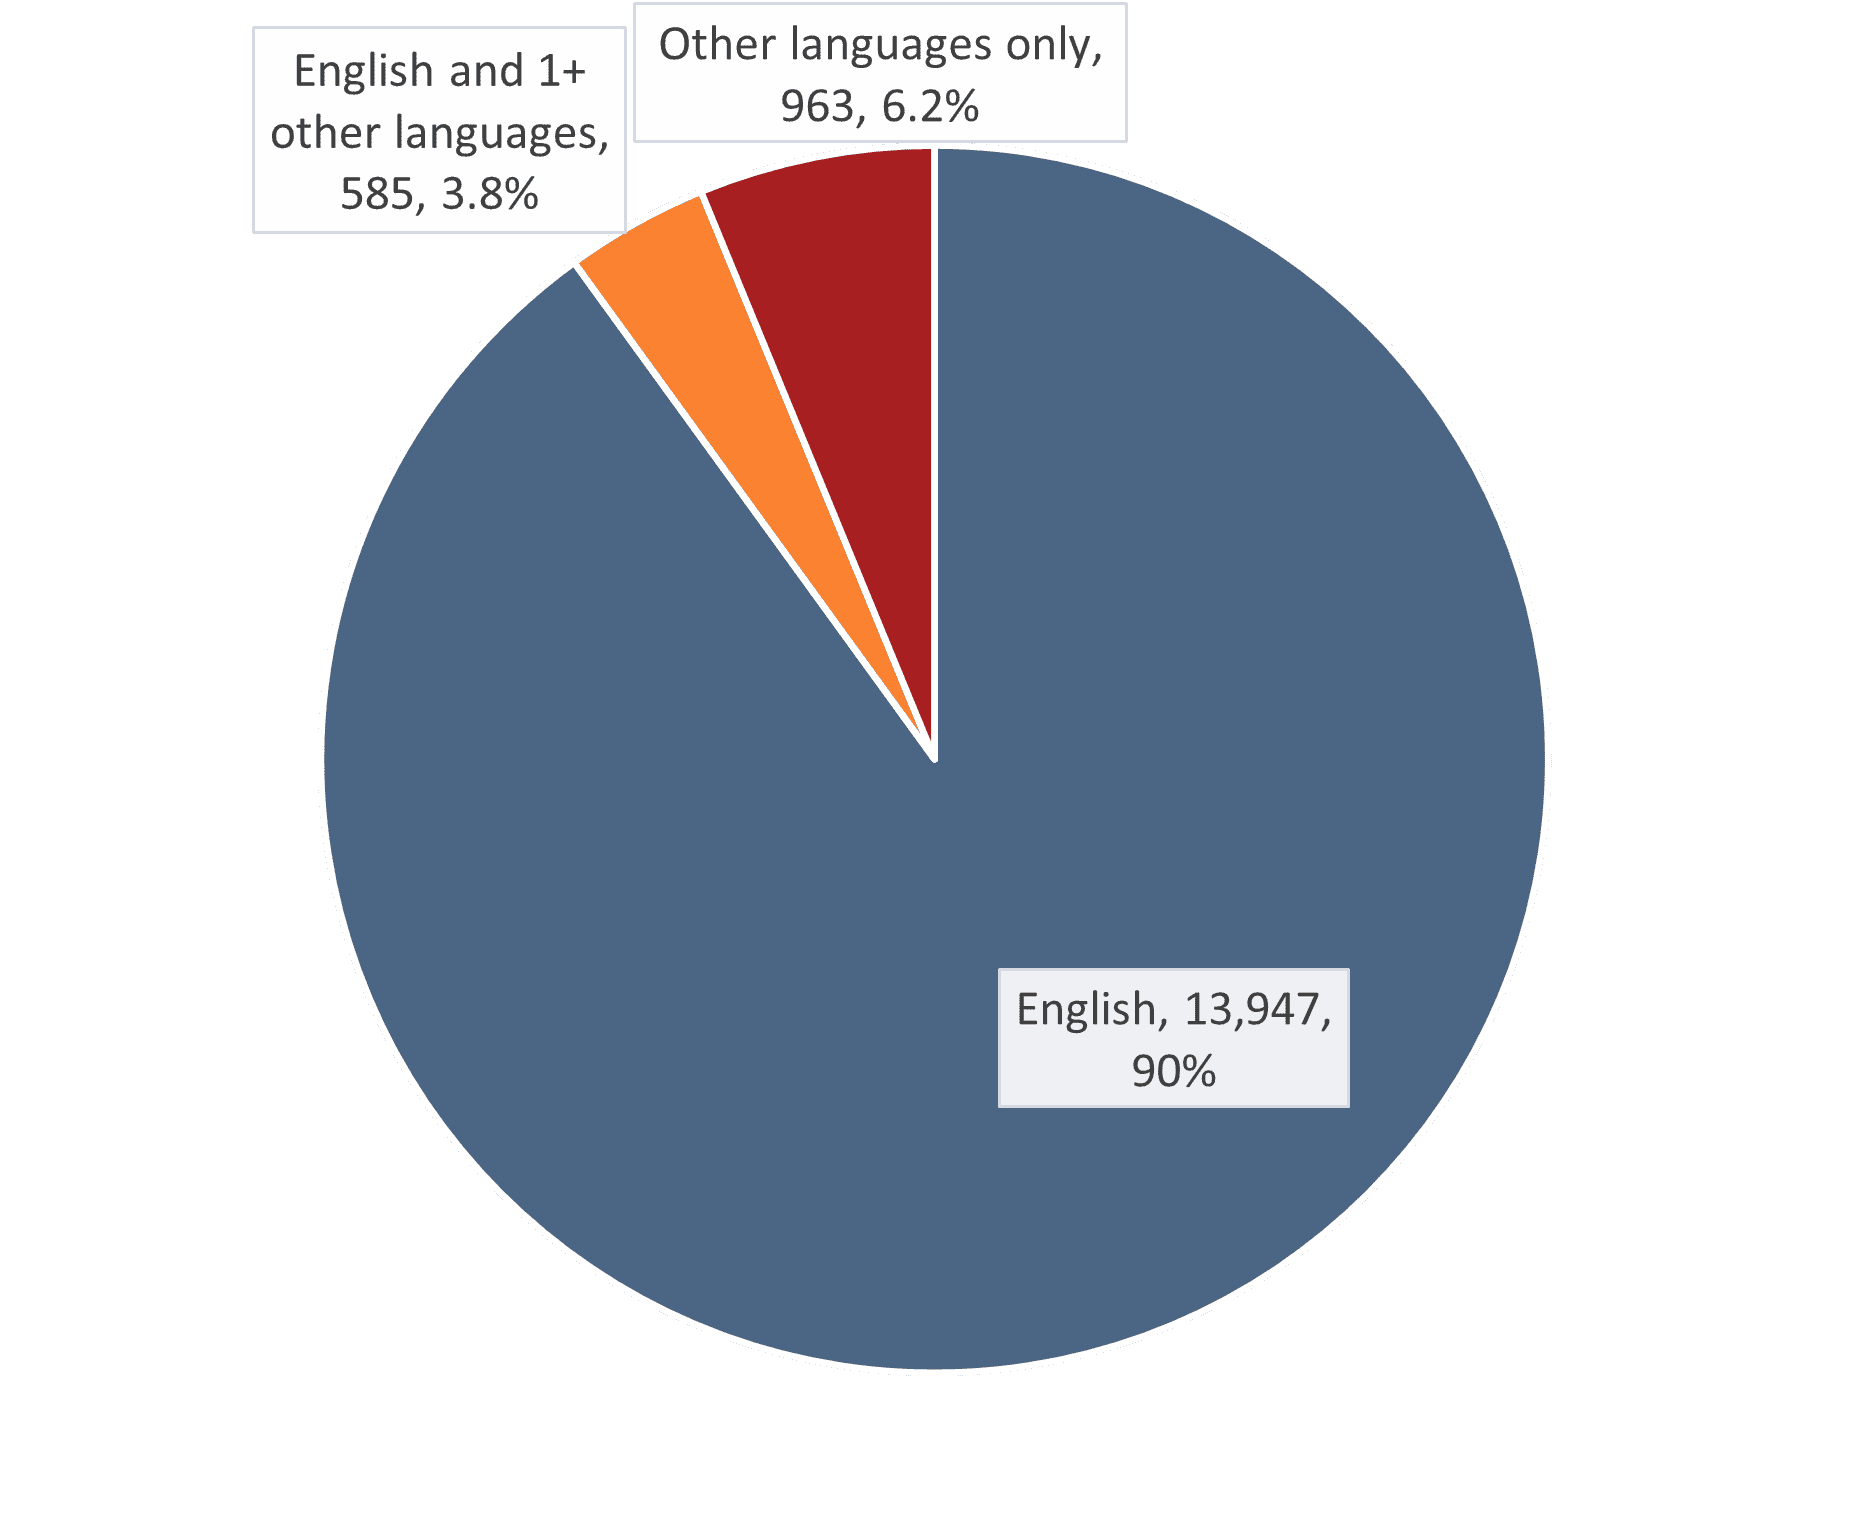
The heads of households who applied to the waitlist reported their language preference, race, ethnicity, sex, disability and veteran status.
Preferred Language
| Preferred Language | Applicants |
|---|---|
| English | 13,947 (90.02%) |
| English and 1+ other languages | 584 (3.77%) |
| Other languages | 963 (6.22%) |
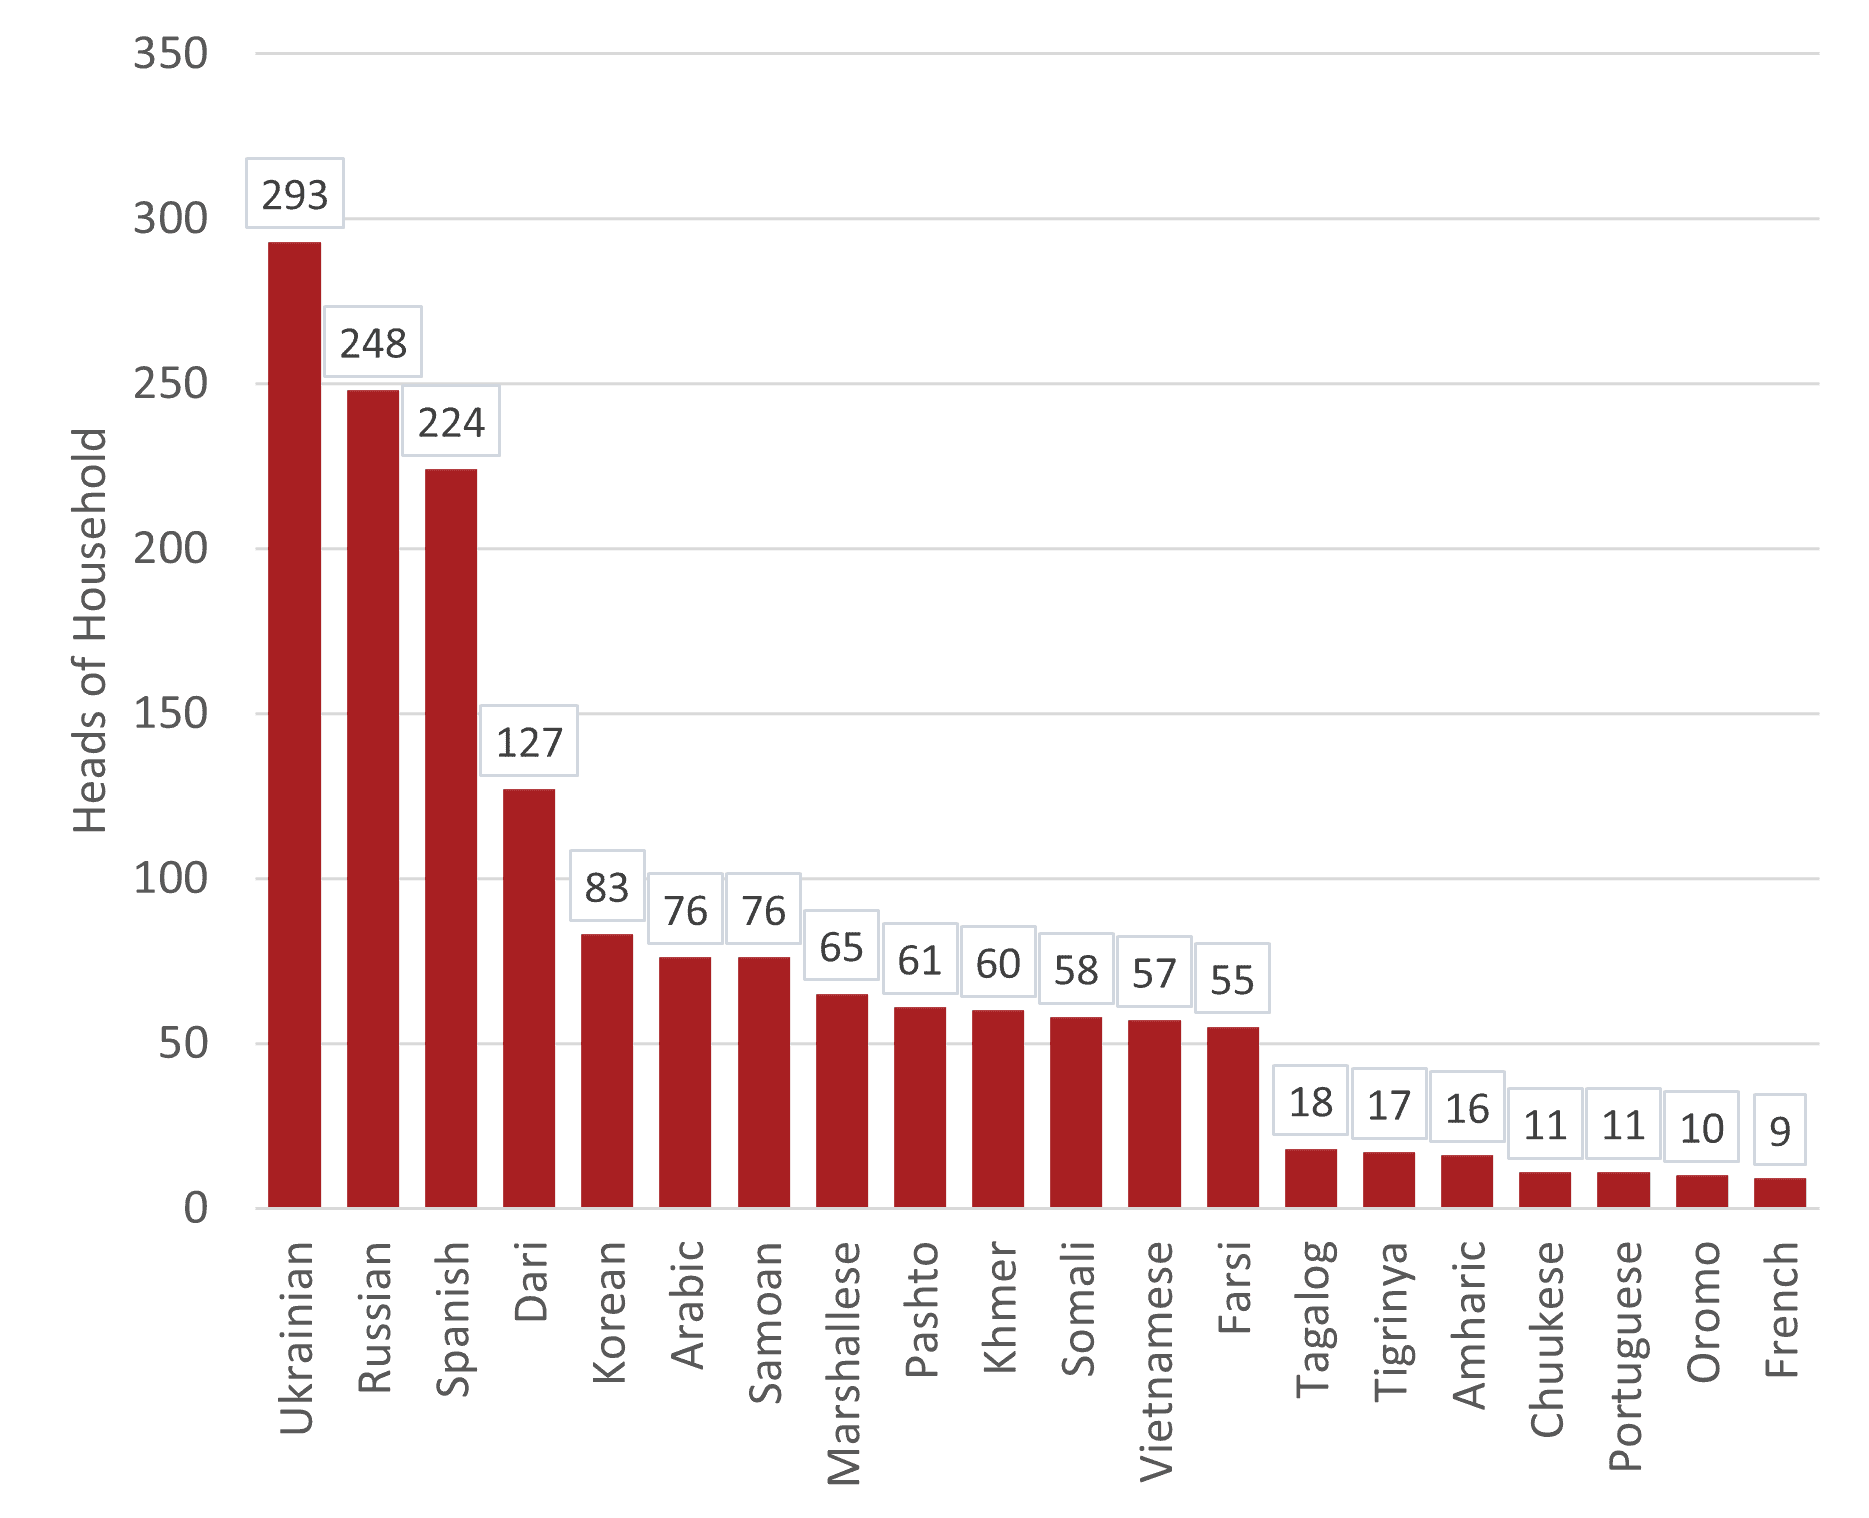
| Language | Heads of Household |
|---|---|
| Ukrainian | 293 (1.89%) |
| Russian | 248 (1.60%) |
| Spanish | 224 (1.45%) |
| Dari | 127 (0.82%) |
| Korean | 83 (0.54%) |
| Arabic | 76 (0.49%) |
| Samoan | 76 (0.49%) |
| Marshallese | 65 (0.42%) |
| Pashto | 61 (0.40%) |
| Khmer | 60 (0.39%) |
| Somali | 58 (0.37%) |
| Vietnamese | 57 (0.37%) |
| Farsi | 55 (0.35%) |
| Tagalog | 18 (0.12%) |
| Tigrinya | 17 (0.11%) |
Sex
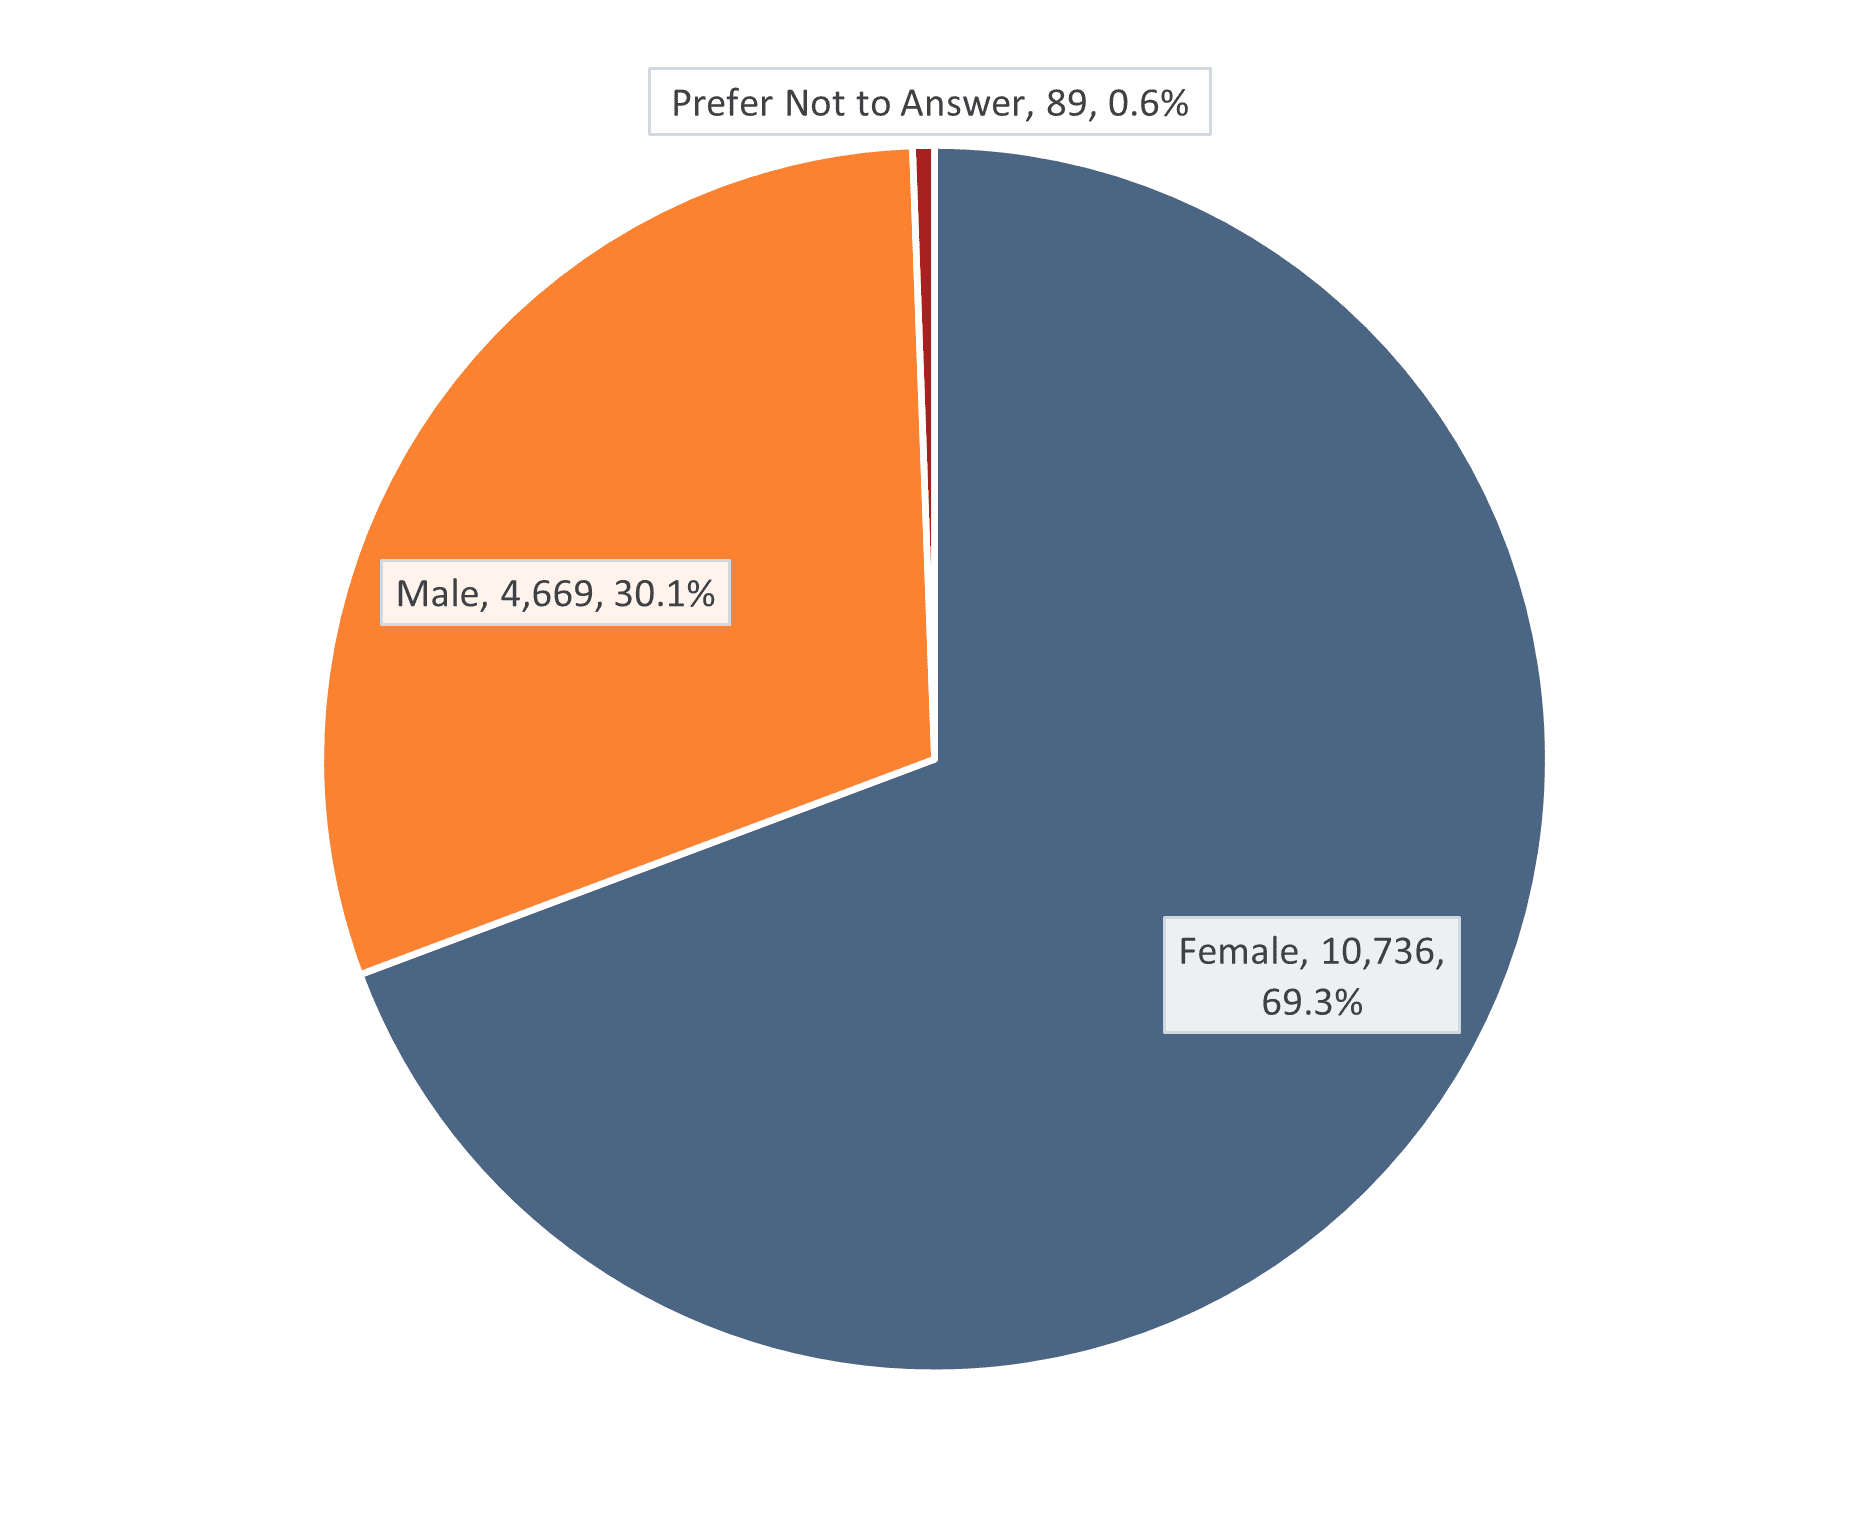
| Sex | Heads of Household |
|---|---|
| Female | 10,736 (69.3%) |
| Male | 4,669 (30.1%) |
| Prefer Not to Answer | 89 (0.6%) |
Disability Status
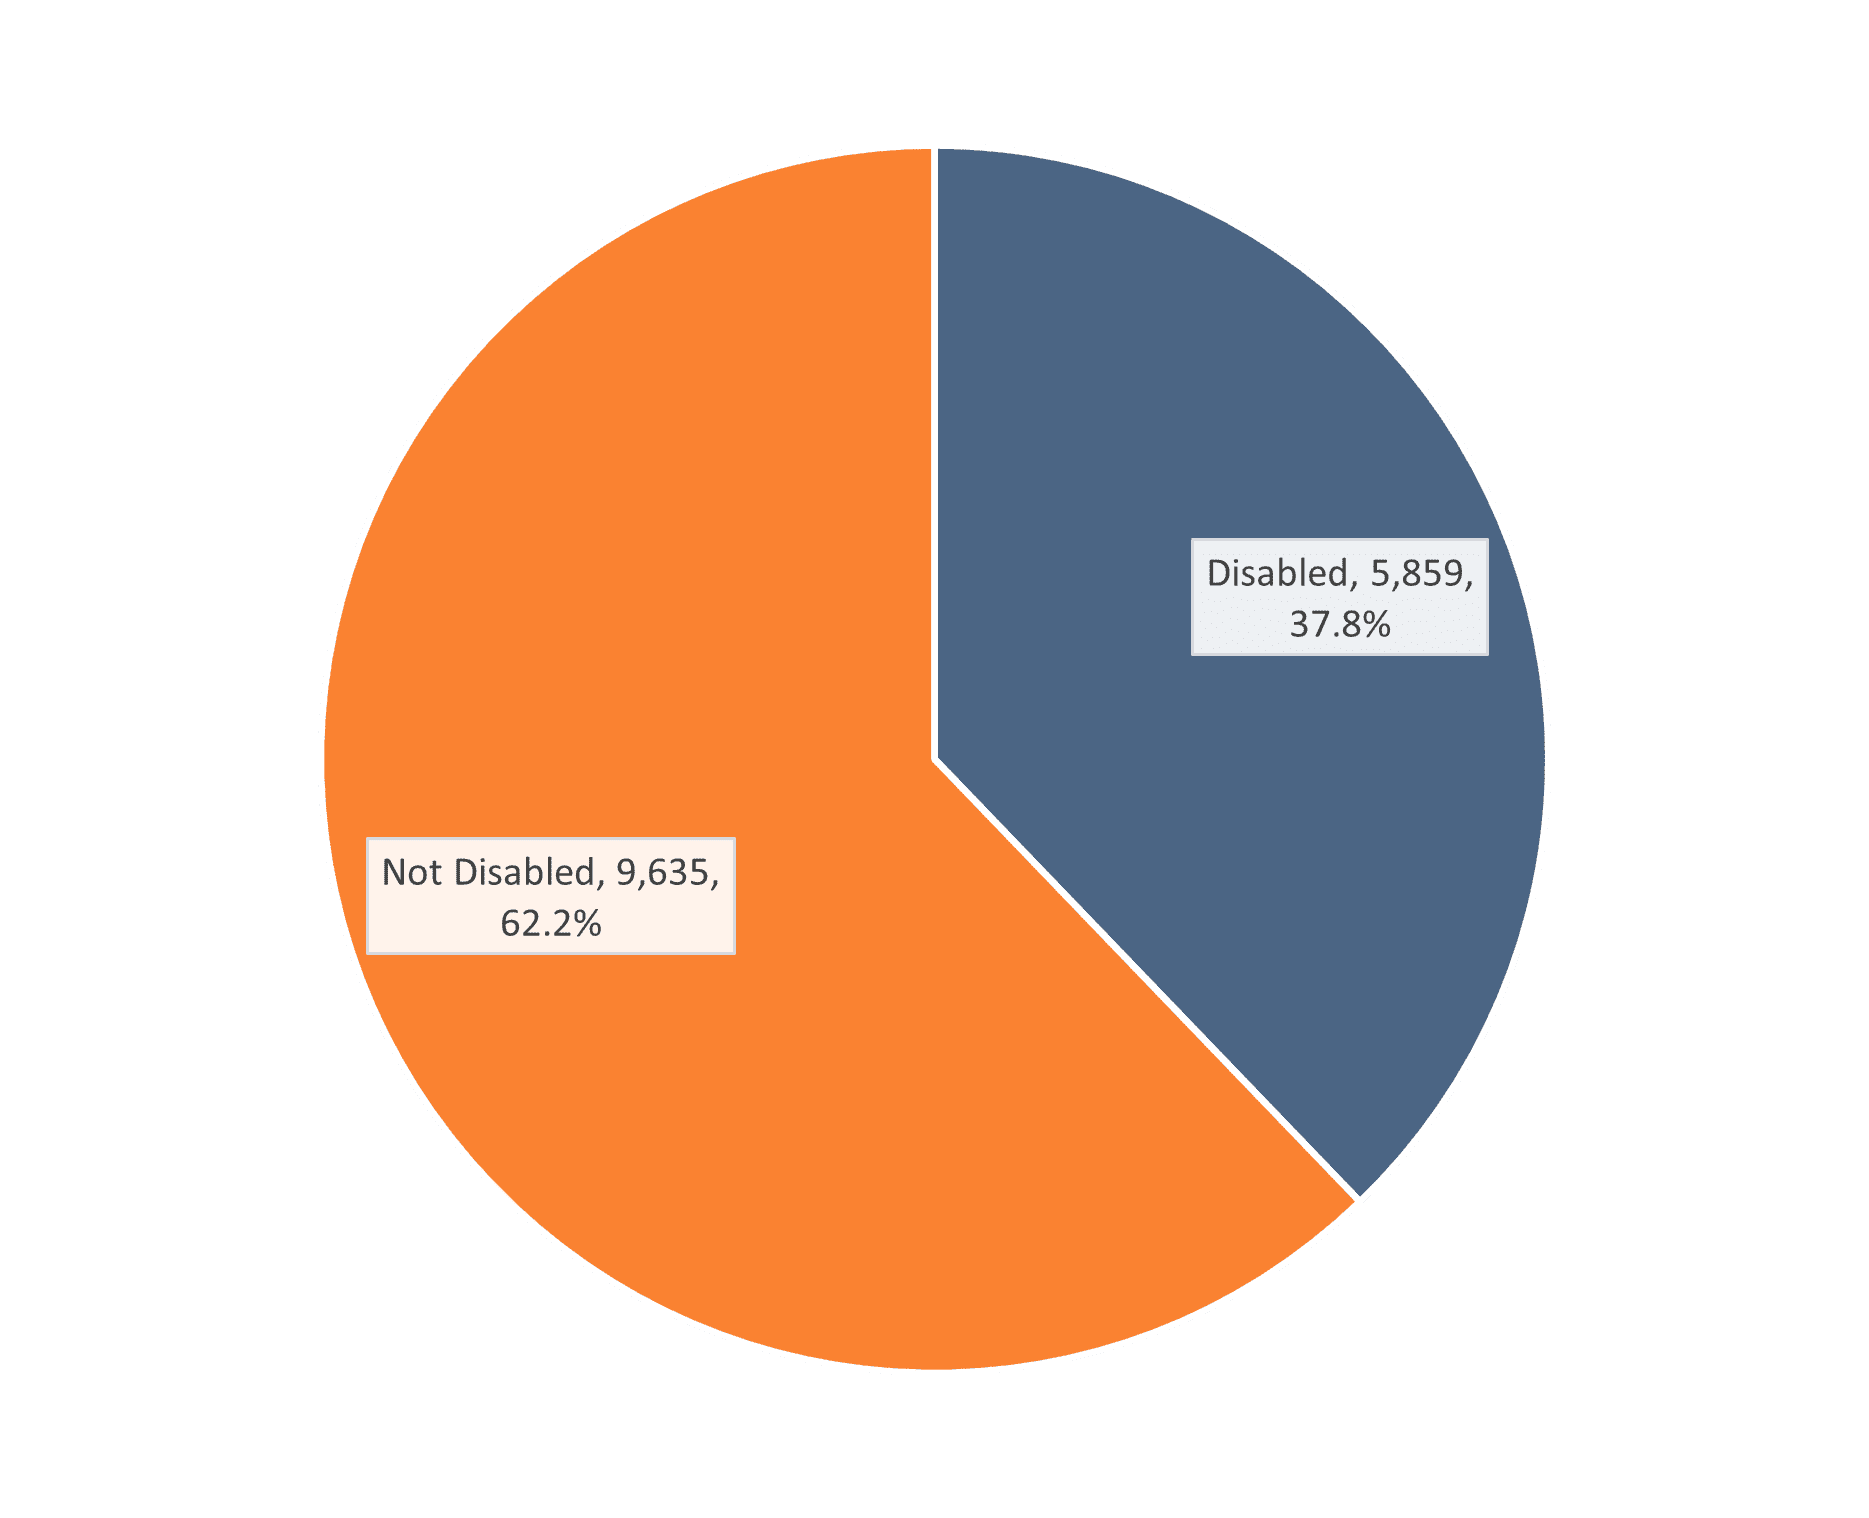
| Disability Status | Heads of Household |
|---|---|
| Disabled | 5,859 (37.8%) |
| Not Disabled | 9,635 (62.2%) |
Veteran Status
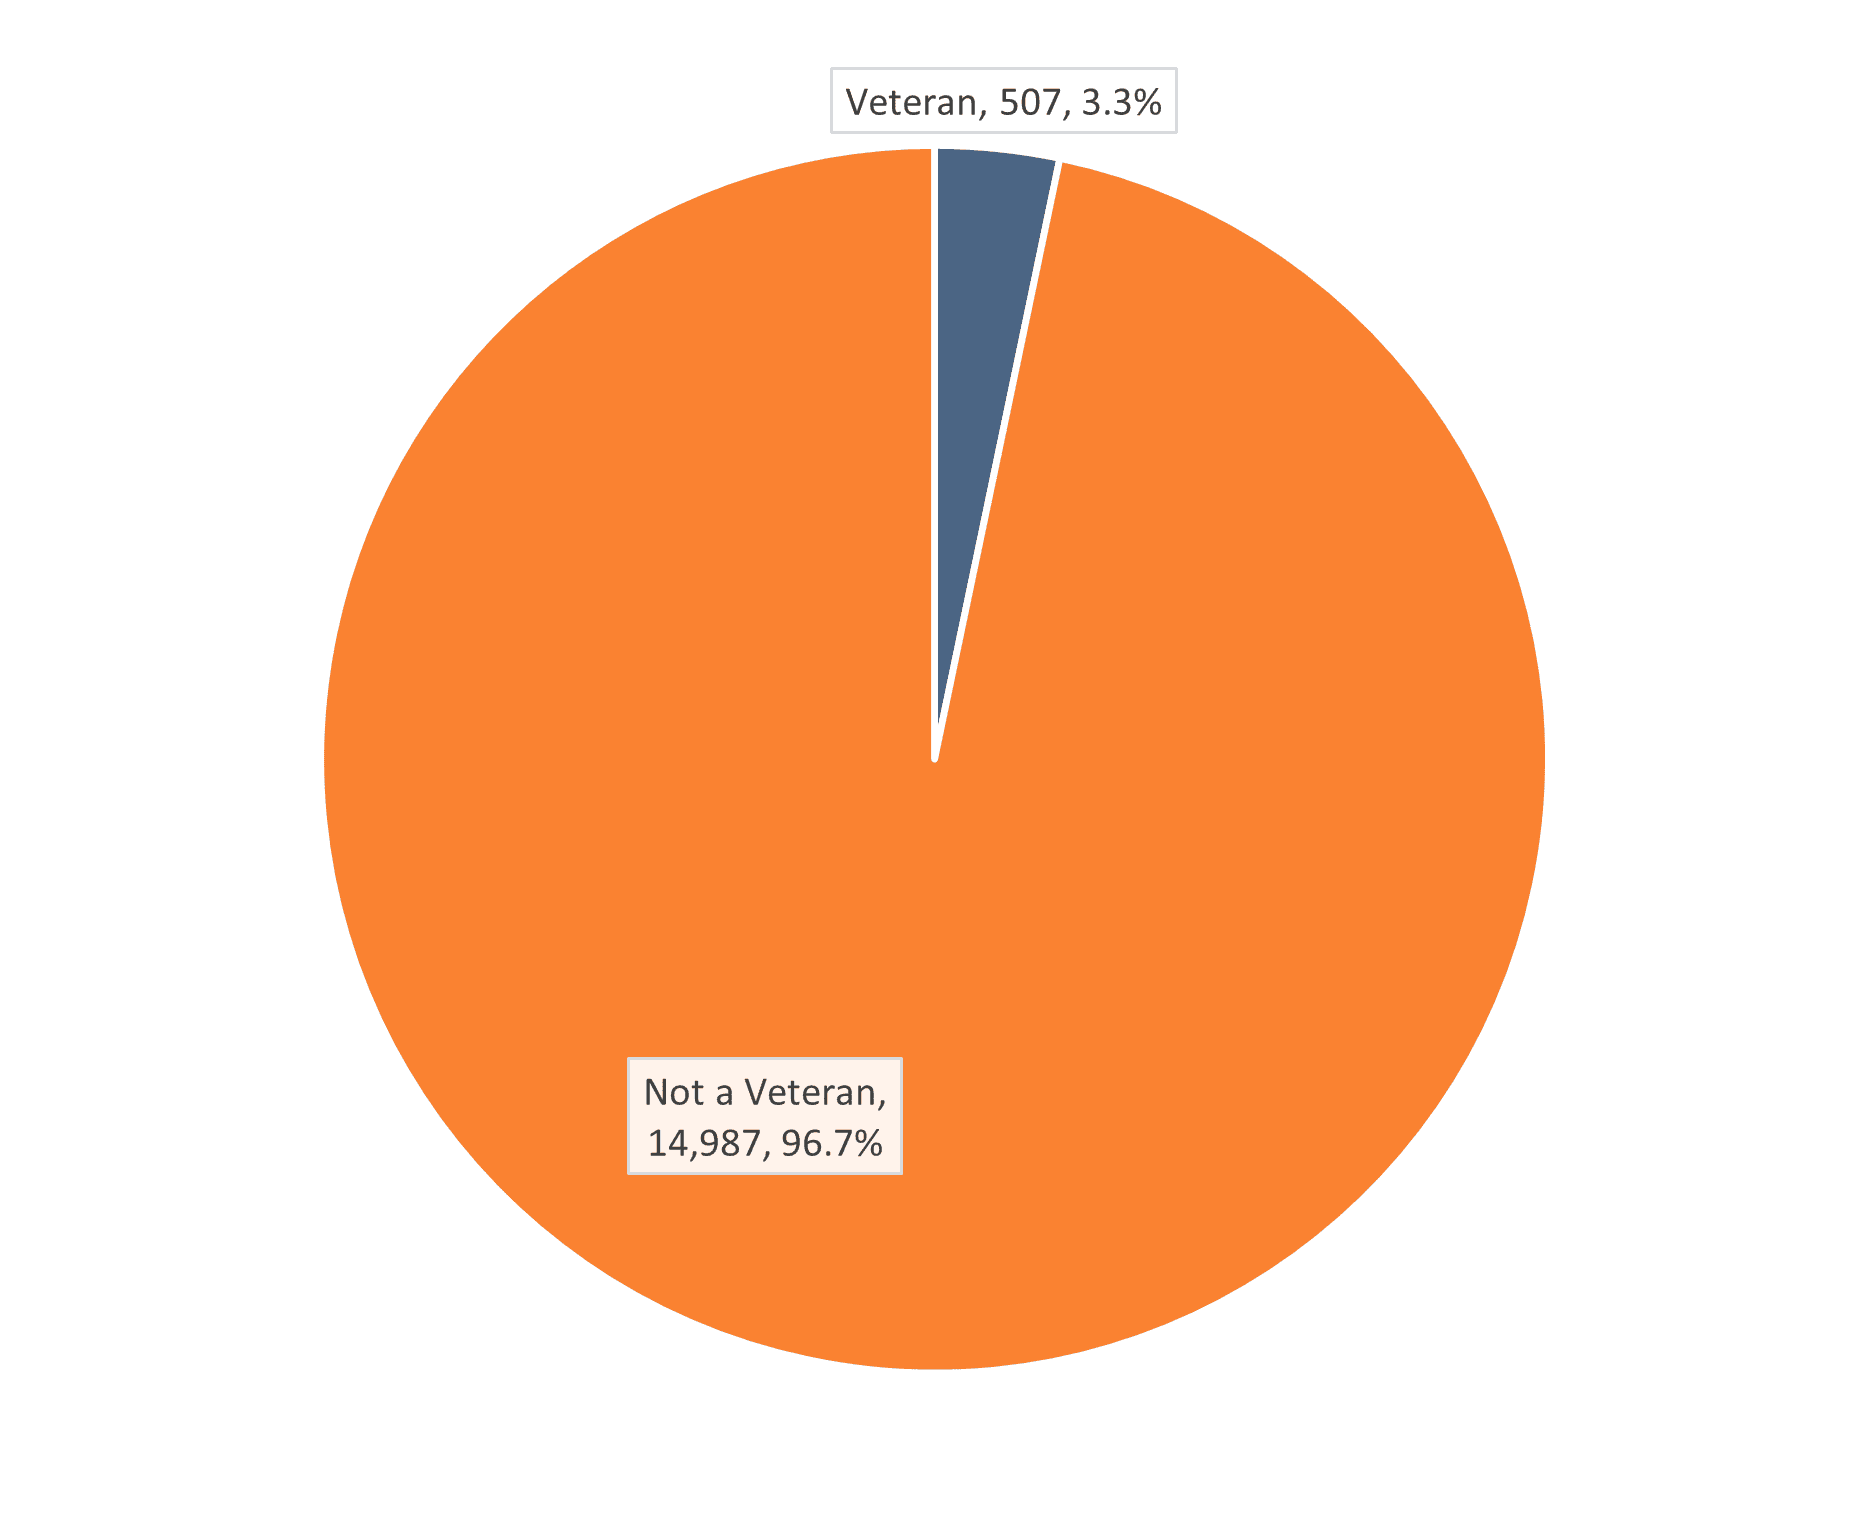
| Veteran Status | Heads of Household |
|---|---|
| Veteran | 507 (3.3%) |
| Not a Veteran | 14,987 (96.7%) |
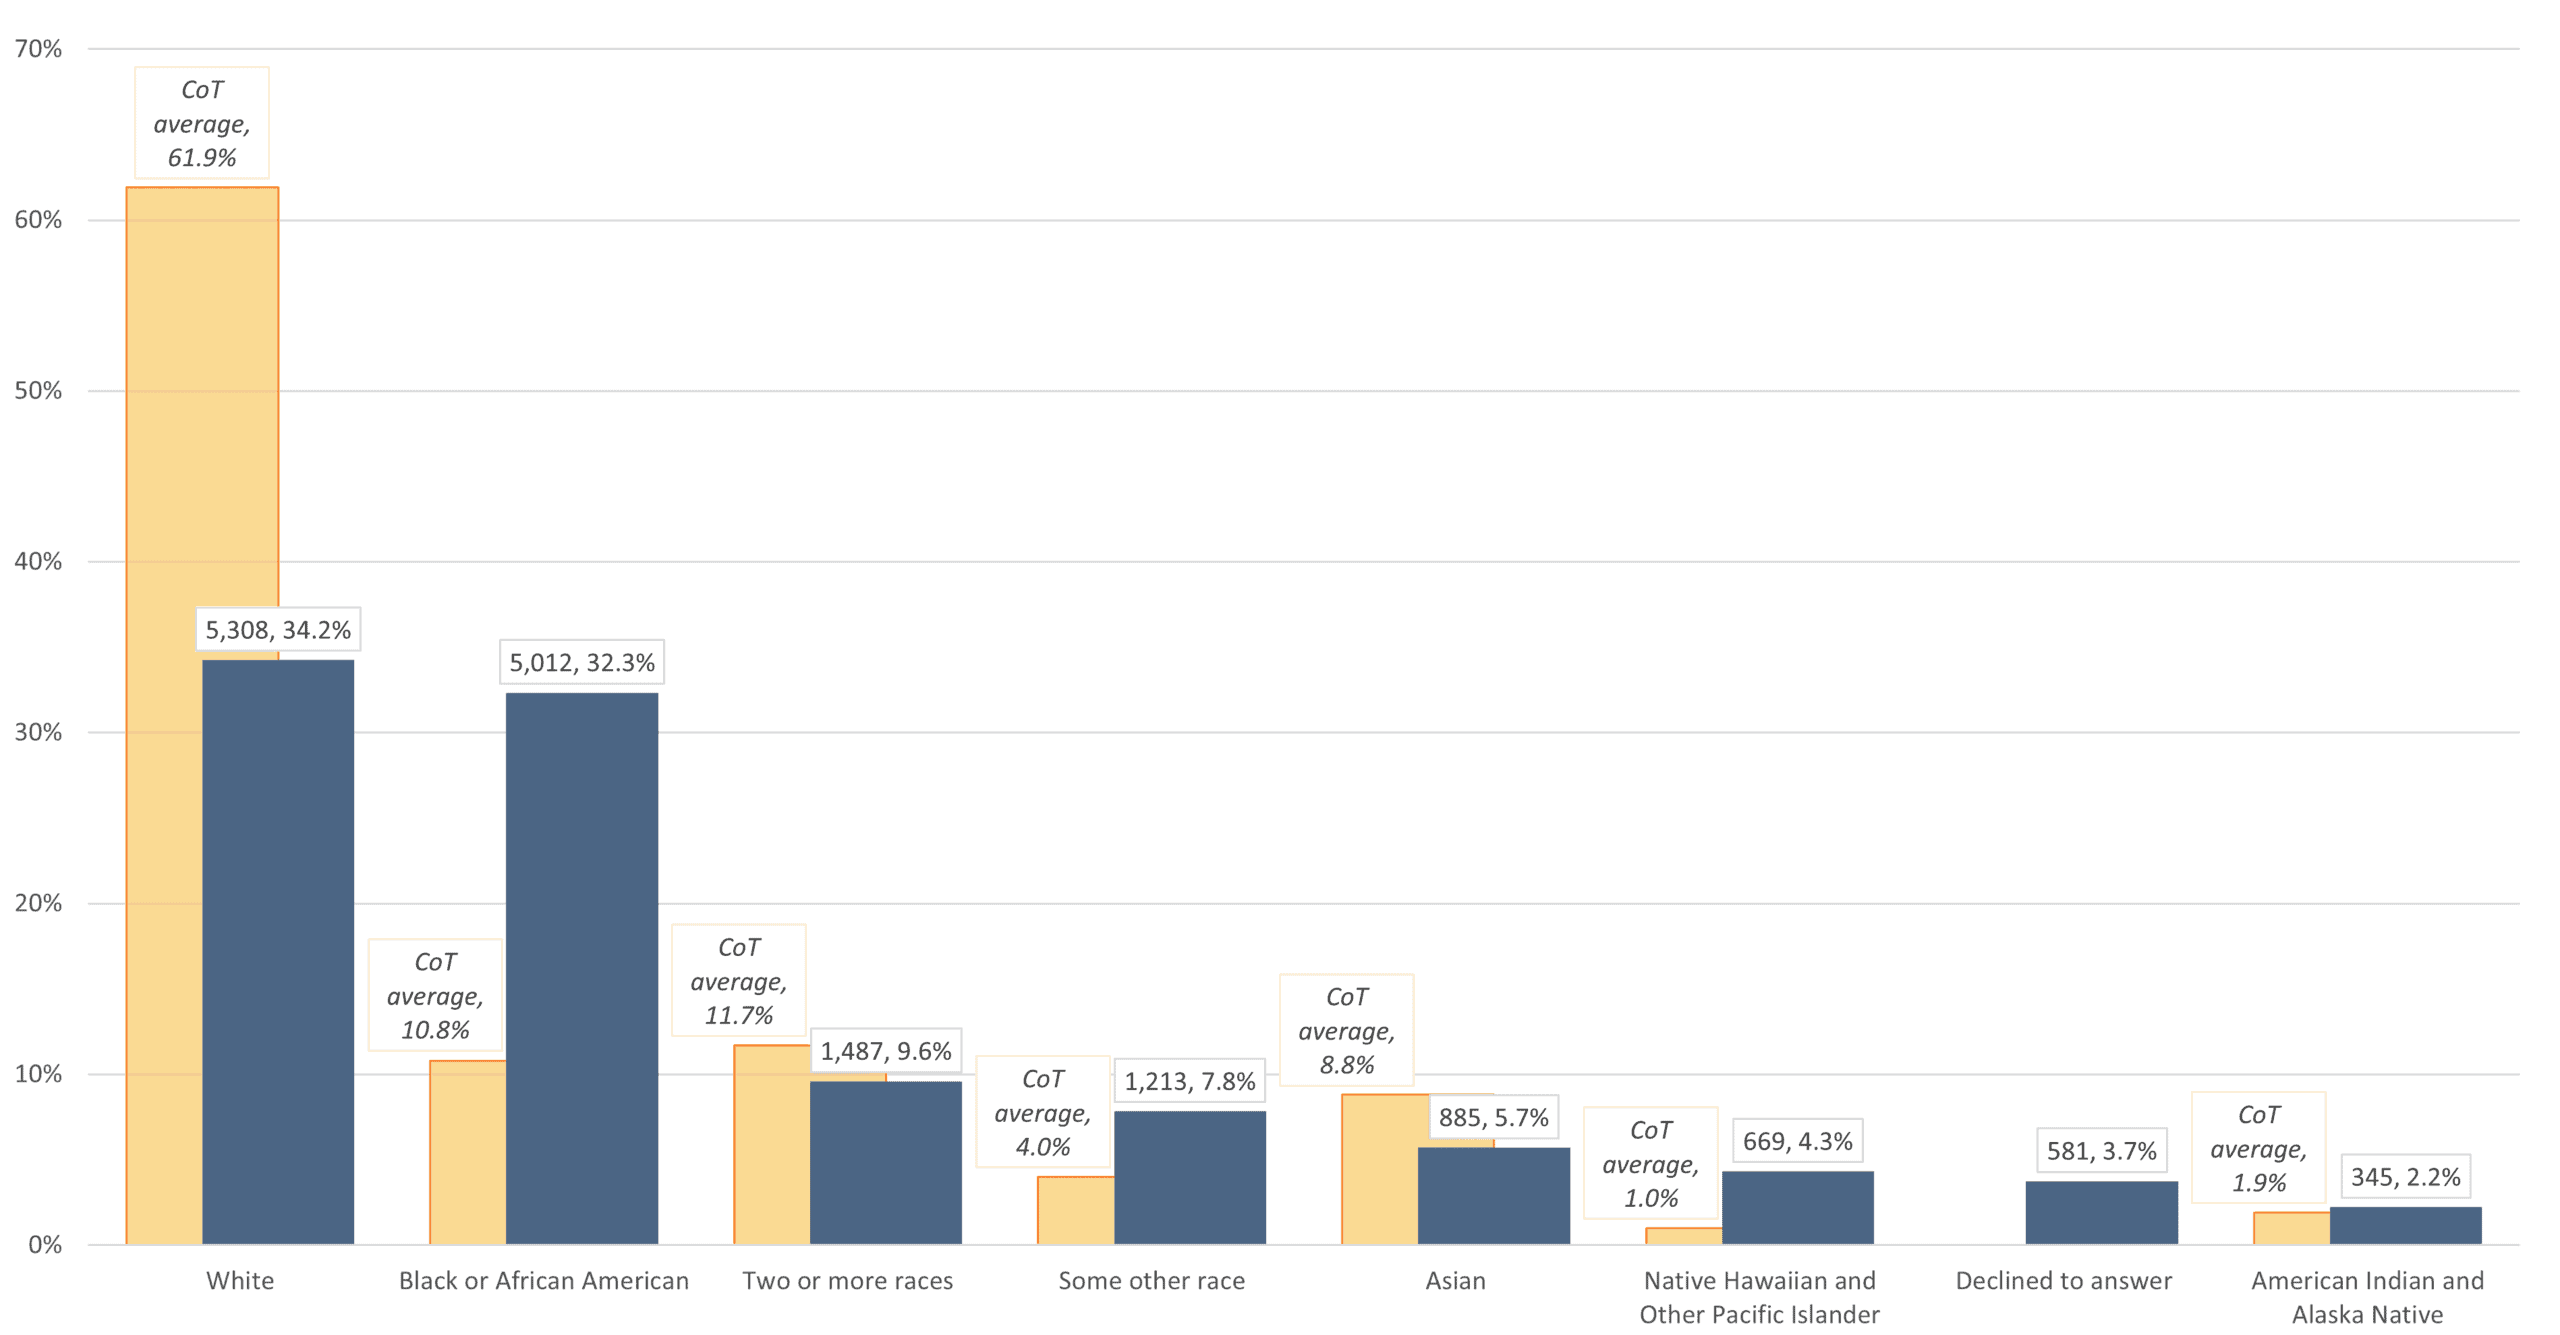
Race & Ethnicity
The demographic information regarding race and ethnicity was compared to City of Tacoma data, indicated in orange.
Race
| Race | Heads of Household | City of Tacoma average |
|---|---|---|
| White | 5,308 34.2% | 61.9% |
| Black or African American | 5,012 32.3% | 10.8% |
| Two or more races | 1,487 9.6% | 11.7% |
| Some other race | 1,213 7.8% | 4.0% |
| Asian | 885 5.7% | 8.8% |
| Native Hawaiian and Other Pacific Islander | 669 4.3% | 1.0% |
| Declined to answer | 581 3.7% | — |
| American Indian and Alaska Native | 345 2.2% | 1.9% |
Ethnicity
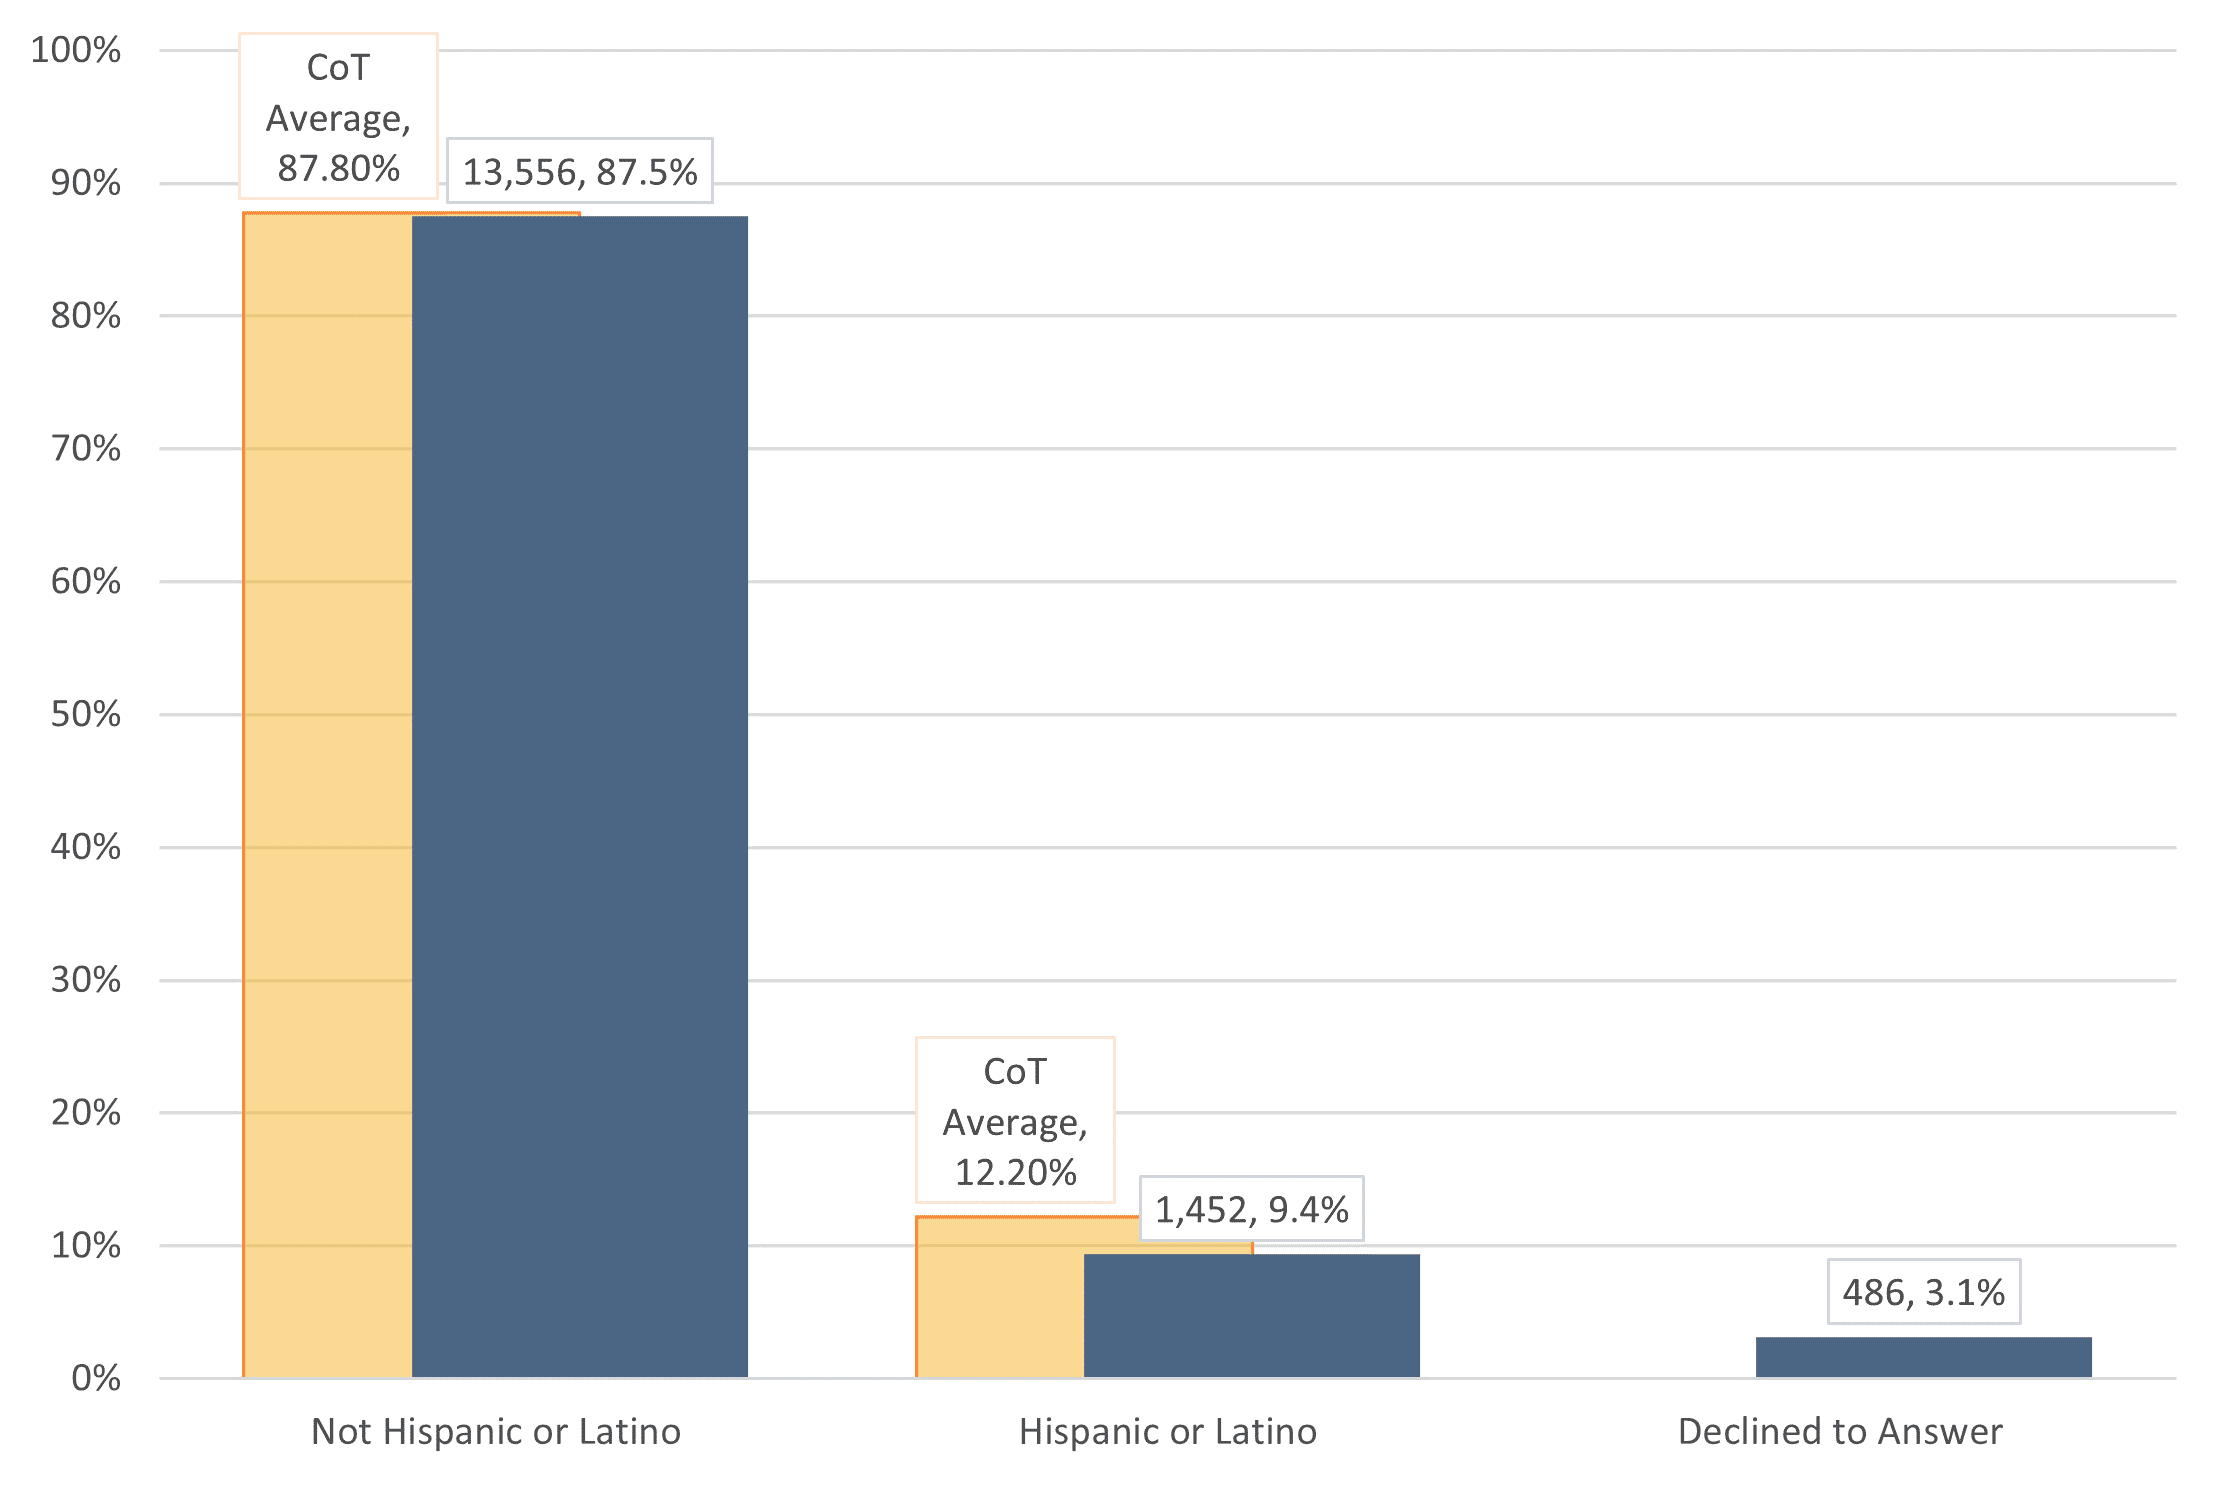
| Ethnicity | Heads of Household | City of Tacoma Average |
|---|---|---|
| Not Hispanic or Latino | 13,556 (87.5%) | 87.8% |
| Hispanic or Latino | 1452 (9.4%) | 12.2% |
| Declined to Answer | 486 (3.1%) | — |
Related:
- 36K applied for help from Tacoma Housing Authority. Here’s how many got on waiting list | Tacoma News Tribune
About Tacoma Housing Authority
Established in 1940, Tacoma Housing Authority provides high-quality, stable, and sustainable housing and supportive services to people in need, in ways that help our clients prosper and help our communities develop equitably. THA develops and manages real estate, provides rental housing, and partners with thousands of private landlords to help families pay the rent in the private rental market. In addition, THA delivers supportive services to help families succeed as tenants, parents, students, wage earners, and builders of assets who can live without assistance. THA seeks to do its work in ways that help our community be an “attractive place to live, work, attend school, shop and play,” and that help Tacoma be “safe, vibrant, prosperous, attractive and just.”